<?xml version="1.0" encoding="utf-8"?><feed xmlns="http://www.w3.org/2005/Atom" ><generator uri="https://jekyllrb.com/" version="4.3.3">Jekyll</generator><link href="http://localhost:4000/feed.xml" rel="self" type="application/atom+xml" /><link href="http://localhost:4000/" rel="alternate" type="text/html" /><updated>2026-04-16T15:55:30-04:00</updated><id>http://localhost:4000/feed.xml</id><title type="html">Lincoln DeCoursey</title><subtitle>The purpose of this blog is for me to have a space to introduce myself and to share my projects. More detail can be found on the About page above.</subtitle><entry><title type="html">Enterprise Linux — iSCSI / Multipath / Pacemaker / Corosync</title><link href="http://localhost:4000/2026/04/13/enterprise-linux-ha-cluster-build.html" rel="alternate" type="text/html" title="Enterprise Linux — iSCSI / Multipath / Pacemaker / Corosync" /><published>2026-04-13T06:00:00-04:00</published><updated>2026-04-13T06:00:00-04:00</updated><id>http://localhost:4000/2026/04/13/enterprise-linux-ha-cluster-build</id><content type="html" xml:base="http://localhost:4000/2026/04/13/enterprise-linux-ha-cluster-build.html"><![CDATA[<h2 id="introduction">Introduction</h2>

<p>Most of the attention in modern infrastructure goes to cloud-native, horizontally-scalable systems. But a large share of the software that keeps real businesses running can’t work that way — whether due to data consistency constraints, licensing, or simply because the application was built assuming it’s the only instance.</p>

<p>For those workloads, the redundancy model is active/standby: one live instance, one warm spare. That’s the class of problem this guide addresses.</p>

<p>What follows is a complete, end-to-end implementation walkthrough:</p>

<ul>
  <li><strong>iSCSI multipath</strong> — shared storage accessible from multiple hosts</li>
  <li><strong>LVM with exclusive activation</strong> — ensuring only one host mounts the volume at a time</li>
  <li><strong>Pacemaker/Corosync</strong> — the cluster manager that orchestrates failover</li>
  <li><strong>PostgreSQL + a floating VIP</strong> — the workload being protected, reachable at a stable address</li>
</ul>

<p>The configuration is validated against four distinct failure scenarios.</p>

<hr />

<h2 id="the-traditional-unix-service-model">The Traditional UNIX Service Model</h2>

<p>System V’s init was, at its core, a table of processes to start and supervise. Its respawn action, configured in /etc/inittab, worked beautifully — if a process died, init restarted it. Supervision was the original model.</p>

<p>But real-world service relationships require ordering, dependencies, and conditional logic — and inittab’s facilities for expressing them were rudimentary at best. As systems grew more complex, that limitation forced a workaround: startup logic moved out of init’s direct management and into subordinate shell scripts. Only the simplest always-on processes — principally getty, which exits on user logout and needs to be relaunched — stayed in inittab directly under respawn. Everything else moved out.</p>

<p>The mechanics were clever. An entire runlevel’s worth of services collapsed onto a single inittab entry that invoked a startup script, which ran the service scripts in sequence. Because shell scripts execute sequentially, any process they launch must return control — which meant services had to daemonize: a deliberate sequence of forks that orphaned the surviving process to PID 1, detached it from the terminal, and returned control to the shell. Without that detachment, the boot sequence would stall.</p>

<p>The table where lifecycle policy had lived — where processes were named, tracked, and given respawn semantics — stopped being populated with individual services. Not because it technically couldn’t be, but because the workaround had moved everything elsewhere. Init still knew how to supervise. It simply had nothing left to supervise.</p>

<p>Without effective supervision, if a service terminated abnormally, it simply disappeared.</p>

<p>For most of UNIX history, this was a reasonable tradeoff. The people writing UNIX daemons were largely Bell Labs researchers, BSD contributors at Berkeley, and the early Internet RFC implementors — often the same people who invented the protocols they were implementing. Vixie maintained and led BIND (named) and wrote cron. Allman wrote sendmail. The software wasn’t flawless — BIND had rough eras, sendmail had rough eras — but these were not average practitioners, and their code was deployed worldwide and scrutinized accordingly. By the time a mid-90s sysadmin was running them in production, the things had been battle-tested in a way most business software never gets to be. The combination of authorship quality, deployment scale, feedback loop tightness, and evolution discipline — sustained over decades — made the assumption a service would remain running indefinitely usually correct in practice.</p>

<p>It also made the workaround invisible as a workaround. Daemonization had originated as a kludge — a way to slip past inittab’s limitations by handing processes off through a sequence of forks — but decades of it simply working, in the hands of people who knew what they were doing, erased that origin. Engineers inheriting the arrangement encountered daemonization as the paradigm, not as the accommodation it had been. You didn’t choose to write a daemon that double-forks; that was simply what writing a daemon <em>meant</em>. The alternative had become difficult even to imagine.</p>

<p>The failure modes changed when the population of authors changed. Business application stacks were built by a much larger, more heterogeneous group, writing under deadline pressure for niche markets rather than global infrastructure. The results were different:</p>
<ol>
  <li>Slow memory leaks triggering the OOM killer.</li>
  <li>Latent bugs causing segfaults on rare or malformed input.</li>
  <li>Unclean shutdowns leaving stale pidfiles that made the system think a service was still running when it wasn’t.</li>
  <li>A subtler class of failure left the process running but non-functional, for example due to exhausted connection pools or deadlocked threads.</li>
</ol>

<p>Discovery of a failed service was usually slow — a user complained or someone noticed by chance. The gap between failure and awareness was often measured in hours or days.</p>

<hr />

<h3 id="the-fragmented-response">The Fragmented Response</h3>

<p>As software reliability faltered, the industry split into three incomplete strategies:</p>

<ul>
  <li><strong>External Monitoring:</strong> Systems like Nagios provided visibility but were purely reactive, alerting humans after a service had died.</li>
  <li><strong>Local Watchdogs:</strong> Tools like Monit attempted active recovery from the “side,” but remained bolt-on additions that required manual coordination with the existing init scripts.</li>
  <li><strong>Alternative Supervisors:</strong> A small subset of visionary teams adopted purpose-built supervisors like <code class="language-plaintext highlighter-rouge">daemontools</code> or <code class="language-plaintext highlighter-rouge">runit</code>. These shifted the paradigm by running services in the foreground to maintain a direct parent-child link for instant restarts.</li>
</ul>

<p>Despite these innovations, none became the standard. Supervision remained the exception, not the default.</p>

<hr />

<h2 id="the-modern-pivot-20112015">The Modern Pivot: 2011–2015</h2>

<p>Between roughly 2011 and 2015, the enterprise Linux world transitioned away from sequential shell scripts and toward declarative service management. Ubuntu’s Upstart took an earlier run at this, but systemd emerged as the definitive standard — shipping as the default in RHEL 7 and across the major distributions shortly after. For the first time since inittab had been hollowed out, services were individually named, tracked, and given lifecycle policy in a central place. A process that exited could be caught and restarted automatically, with configurable backoff. The supervision capability was back.</p>

<p>Three things about systemd’s model are worth being exact about.</p>

<ul>
  <li>
    <p><strong>Restart is opt-in.</strong> On a current enterprise Linux distribution, if you kill a running service — chronyd, say — it stays dead. Someone has to have written <code class="language-plaintext highlighter-rouge">Restart=on-failure</code> or similar into the unit file for supervision to apply. The mechanism exists again, but whether any given service is entered into it with meaningful lifecycle policy is still a per-service decision made by whoever packaged it.</p>
  </li>
  <li>
    <p><strong>The watchdog is shallower than it looks.</strong> Restart on process exit is a solved problem: the kernel reports the exit, Restart=on-failure acts on it, and the service comes back. Restart on watchdog timeout is an opportunistic extension — if the service emits heartbeats via sd_notify and stops, systemd restarts it. A cheap win for a real class of failure, worth having. But the heartbeat is structurally a liveness signal only, not a health check. That is the appropriate scope for the mechanism — a daemon that knew it was internally unhealthy would typically try to recover in-process or exit deliberately, not go silent.</p>
  </li>
  <li>
    <p><strong>There is no hook for protocol-aware health checks.</strong> systemd provides no plugin interface where a probe for a given protocol is implemented once by people who understand that protocol, and the deployment supplies the specifics: endpoint, credentials, expected response. Whether to use it would be the operator’s call, and package maintainers could ship sensible baselines that most deployments would never need to touch. In this respect systemd lags its container-world analog: Kubernetes’ kubelet has shipped first-class health probes driving restart since early in its life.</p>
  </li>
</ul>

<p>A service with a configured watchdog <em>looks</em> supervised, and in a narrow sense is — but only against the specific failure of the main loop stalling entirely. The appearance of coverage invites eyes off the ball on everything the watchdog cannot see. The second is sociological: because the deeper hook does not exist in the init system, deep health checking has been routed to monitoring systems that alert humans rather than remediate. That routing has hardened into a convention — it is how practitioners now talk about the problem, divide responsibility for it, and draw the line between “supervision” and “monitoring” — but the convention is an artifact of what the tooling made available.</p>

<hr />

<h2 id="the-limits-of-local-supervision">The Limits of Local Supervision</h2>

<p>While systemd’s limitations — like opt-in restarts and shallow health checks — are mitigatable through unit edits or sidecar watchdogs, these fixes ignore a fundamental architectural boundary. A supervisor running on a host cannot survive the death of that host. When hardware fails, everything on it disappears simultaneously — the application, the supervisor, the monitoring agent, all of it. There is nothing left to detect the failure or act on it.</p>

<p>Solving that requires crossing a physical boundary — detection and recovery logic must run somewhere else, on separate hardware that can observe the loss and respond to it.</p>

<p>This architectural ceiling raises a practical concern: is it even worth the engineering hours to continue refining a local supervisor?</p>

<p>–</p>

<h3 id="two-populations-two-mental-models">Two Populations, Two Mental Models</h3>

<p>The core insight is that the adoption timeline bifurcated by organizational maturity, and the timing of when you “discovered” the problem determined which solution looked obvious — and that perception has largely frozen in place.</p>

<p><strong>Enterprise shops</strong> in the late 90s and early 2000s were already running Veritas Cluster Server, HACMP, or Sun Cluster. <strong>Cluster Resource Management (CRM)</strong> was not a new idea to them — it was the established answer. When virtualization arrived, Hypervisor-level HA was an additional layer on top of something that already existed.</p>

<p><strong>SMB and mid-market</strong> either ignored the problem (most of them, most of the time) or discovered it coincidentally around the same time VMware was making <strong>Hypervisor-level HA</strong> trivially easy to enable. CRM never entered the conversation — not because it was evaluated and rejected, but because it was never seriously considered.</p>

<p>The result: two populations with completely different mental models of what HA means, shaped more by when they first had to care about the problem than by any systematic evaluation of the options.</p>

<hr />

<h2 id="cluster-resource-management">Cluster Resource Management</h2>

<p>The core idea is simple: instead of one server running the workload, there are two. One is active, one stands by. Because they are separate physical systems, each can observe the other across that hardware boundary — and when the active node fails or is taken out of service, the standby has both the awareness and the mechanism to take over.</p>

<p>Whether the transition is unplanned (a node failure) or planned (maintenance), the result is the same: the service goes offline momentarily while the standby takes over.</p>

<p>The now-standby node can be patched, rebooted, reconfigured, replaced, or otherwise wrenched on at whatever pace the work requires. The service remains available throughout.</p>

<hr />

<h2 id="hypervisor-level-ha">Hypervisor-Level HA</h2>

<p>VM HA operates at the hypervisor layer, coordinating across physical hosts. When a host fails, the workload is restarted on another — automatically. Live migration goes further: a running workload can be evacuated to another host with no interruption for planned host maintenance.</p>

<p>What it does not address is anything occurring inside the guest: a process that has died, a service that is running but off in the weeds, or maintenance that requires the guest itself to come down.</p>

<hr />

<h2 id="the-case-for-cluster-resource-management">The Case for Cluster Resource Management</h2>

<p>If the hypervisor will keep your VM running through hardware failure, and evacuate it without interruption for host maintenance, what do you need a standby node for?</p>

<p><strong>Hypervisor-Level HA as a Cluster Resource Management replacement is a category error.</strong></p>

<ol>
  <li>Hardware failure is visible and named. People solve it.</li>
  <li>Service failure is invisible and unnamed. People absorb it.</li>
  <li>Hypervisor-Level HA solves #1. It does not touch #2.</li>
  <li>Cluster Resource Management solves both.</li>
  <li>Substituting #3 for #4 leaves #2 unaddressed — and unrecognized.</li>
</ol>

<p><strong>Concretely illustrated:</strong></p>

<blockquote>
  <p>The order entry application maintains persistent connections to its database server. During network maintenance, a device in the network path was rebooted — sniping those connections. The application made no attempt to reconnect. It simply hung, despite the fact that a retry would have succeeded. Only restarting the application resolved it. Throughout the outage, the login page loaded fine; only attempting login surfaced the error. Catching this proactively would require a synthetic check that exercises a full user login, not just an HTTP 200 on the login page.</p>
</blockquote>

<p>This is actually a pretty typical scenario, and it’s something that a well-configured CRM would have detected and resolved within about 60 seconds, avoiding an outage that would otherwise have been prolonged and ultimately reported by customers.</p>

<p>Meanwhile, you’re fielding “why didn’t the failover work?”</p>

<p>What makes this insidious is that various incidents appear unrelated, preventing pattern recognition. Each incident presents as a local, self-contained hiccup, and is therefore resolved in isolation. The result is continued treatment of symptoms while the absence of health-aware supervision remains unrecognized.</p>

<p><strong>Guest maintenance still requires the guest to come down.</strong> Live migration handles host maintenance elegantly. It does nothing for OS patching or any other work that requires rebooting the VM itself.</p>

<p><strong>The standby instance absorbs failures that happen during maintenance.</strong></p>

<ol>
  <li>Maintenance can break mid-way.</li>
  <li>Snapshots exist but reverting has real costs — lost work, lost context, deferred problem.</li>
  <li>In practice you don’t revert. You work through it.</li>
</ol>

<p>With Cluster Resource Management, that work happens on the standby node. Whatever goes wrong, goes wrong there, while the active system continues serving production. Without a standby, the same failures unfold on the only instance you have.</p>

<p><strong>The standby instance is a resource you can’t fully predict how you’ll use.</strong></p>

<ol>
  <li>Failure scenarios are unpredictable in their specifics.</li>
  <li>The runbook will be wrong in some way.</li>
  <li>The standby is what gives you room to adapt when it is.</li>
  <li>You can’t enumerate its value in advance — you just know from experience that you’ll need it.</li>
</ol>

<hr />

<h2 id="introducing-pacemakercorosync">Introducing Pacemaker/Corosync</h2>

<p>Pacemaker is the de facto standard for application-level HA clustering on Linux. Development began in 2004 as a collaborative effort through the ClusterLabs community, with sustained backing from Red Hat and SUSE. It ships with most modern Linux distributions and has been deployed in critical environments worldwide.</p>

<p>Other tools exist in adjacent space on Linux — Keepalived being a popular option, particularly for simpler failover scenarios — but Pacemaker/Corosync is what HA clustering on Linux means in the enterprise.</p>

<hr />

<h2 id="ha-cluster-lab-build">HA Cluster Lab Build</h2>

<h3 id="physical--hypervisor-layer">Physical / Hypervisor Layer</h3>

<table>
  <thead>
    <tr>
      <th>Host</th>
      <th>Role</th>
    </tr>
  </thead>
  <tbody>
    <tr>
      <td>Dell PowerEdge R620 Node A</td>
      <td>Proxmox VE — pve1.lab5.decoursey.com (192.168.4.231) — iDRAC7 (192.168.4.241)</td>
    </tr>
    <tr>
      <td>Dell PowerEdge R620 Node B</td>
      <td>Proxmox VE — pve2.lab5.decoursey.com (192.168.4.232) — iDRAC7 (192.168.4.242)</td>
    </tr>
  </tbody>
</table>

<h3 id="network-segments">Network Segments</h3>

<table>
  <thead>
    <tr>
      <th>Bridge</th>
      <th>Segment</th>
      <th>Purpose</th>
    </tr>
  </thead>
  <tbody>
    <tr>
      <td>vmbr0</td>
      <td>Home network</td>
      <td>Proxmox mgmt, TrueNAS mgmt</td>
    </tr>
    <tr>
      <td>vmbr1</td>
      <td>10.0.5.0/24</td>
      <td>Internal — RHEL cluster traffic, PostgreSQL</td>
    </tr>
    <tr>
      <td>vmbr2</td>
      <td>192.168.2.0/24</td>
      <td>iSCSI storage path 1</td>
    </tr>
    <tr>
      <td>vmbr3</td>
      <td>192.168.3.0/24</td>
      <td>iSCSI storage path 2 (multipath)</td>
    </tr>
  </tbody>
</table>

<p>Machines obtained second-hand. BIOS and firmware flashed to latest and explicitly restored to factory default settings. BIOS Version 2.9.0 / iDRAC Firmware 2.65.65.65.</p>

<h3 id="virtual-machine-inventory">Virtual Machine Inventory</h3>

<table>
  <thead>
    <tr>
      <th>VM</th>
      <th>VMID</th>
      <th>Role</th>
      <th>Proxmox Host</th>
    </tr>
  </thead>
  <tbody>
    <tr>
      <td>VyOS</td>
      <td>100</td>
      <td>NAT Gateway</td>
      <td>pve1</td>
    </tr>
    <tr>
      <td>TrueNAS SCALE</td>
      <td>101</td>
      <td>iSCSI SAN</td>
      <td>pve1</td>
    </tr>
    <tr>
      <td>rhel1</td>
      <td>121</td>
      <td>Cluster Node 1</td>
      <td>pve1</td>
    </tr>
    <tr>
      <td>rhel2</td>
      <td>222</td>
      <td>Cluster Node 2</td>
      <td>pve2</td>
    </tr>
  </tbody>
</table>

<h3 id="ip-address-plan">IP Address Plan</h3>

<table>
  <thead>
    <tr>
      <th>Host</th>
      <th>Interface</th>
      <th>IP</th>
      <th>Purpose</th>
    </tr>
  </thead>
  <tbody>
    <tr>
      <td>TrueNAS</td>
      <td>NIC1</td>
      <td>DHCP reservation</td>
      <td>Management</td>
    </tr>
    <tr>
      <td>TrueNAS</td>
      <td>NIC2</td>
      <td>192.168.2.1/24</td>
      <td>iSCSI portal 1</td>
    </tr>
    <tr>
      <td>TrueNAS</td>
      <td>NIC3</td>
      <td>192.168.3.1/24</td>
      <td>iSCSI portal 2</td>
    </tr>
    <tr>
      <td>rhel1</td>
      <td>ens18</td>
      <td>10.0.5.21/24</td>
      <td>Internal / cluster</td>
    </tr>
    <tr>
      <td>rhel1</td>
      <td>ens19</td>
      <td>192.168.2.21/24</td>
      <td>iSCSI path 1</td>
    </tr>
    <tr>
      <td>rhel1</td>
      <td>ens20</td>
      <td>192.168.3.21/24</td>
      <td>iSCSI path 2</td>
    </tr>
    <tr>
      <td>rhel2</td>
      <td>ens18</td>
      <td>10.0.5.22/24</td>
      <td>Internal / cluster</td>
    </tr>
    <tr>
      <td>rhel2</td>
      <td>ens19</td>
      <td>192.168.2.22/24</td>
      <td>iSCSI path 1</td>
    </tr>
    <tr>
      <td>rhel2</td>
      <td>ens20</td>
      <td>192.168.3.22/24</td>
      <td>iSCSI path 2</td>
    </tr>
    <tr>
      <td>Cluster VIP</td>
      <td>—</td>
      <td>10.0.5.200/24</td>
      <td>Floating VIP (Pacemaker managed)</td>
    </tr>
  </tbody>
</table>

<h3 id="storage-layout">Storage Layout</h3>

<table>
  <thead>
    <tr>
      <th>Layer</th>
      <th>Name</th>
      <th>Details</th>
    </tr>
  </thead>
  <tbody>
    <tr>
      <td>TrueNAS pool</td>
      <td>tank</td>
      <td>ZFS pool on virtual disk</td>
    </tr>
    <tr>
      <td>zvol</td>
      <td>tank/cluster1</td>
      <td>20GB block device</td>
    </tr>
    <tr>
      <td>iSCSI target</td>
      <td>iqn.2005-10.org.freenas.ctl:cluster1</td>
      <td>Two portals</td>
    </tr>
    <tr>
      <td>Multipath device</td>
      <td>/dev/mapper/mpatha</td>
      <td>Two paths assembled</td>
    </tr>
    <tr>
      <td>WWN</td>
      <td>36589cfc00000069a44bab397d95776b4</td>
      <td>Immutable device identifier</td>
    </tr>
    <tr>
      <td>udev symlink</td>
      <td>/dev/clusterstorage/cluster1</td>
      <td>Stable name by WWN</td>
    </tr>
    <tr>
      <td>LVM PV/VG/LV</td>
      <td>vg-cluster1 / lv-cluster1</td>
      <td>18G, system_id protected</td>
    </tr>
    <tr>
      <td>Filesystem</td>
      <td>XFS on /mnt/cluster1</td>
      <td>Managed by Pacemaker</td>
    </tr>
    <tr>
      <td>PostgreSQL data</td>
      <td>/mnt/cluster1/pgsql/data</td>
      <td>On shared storage</td>
    </tr>
  </tbody>
</table>

<hr />

<h2 id="phase-1--truenas-iscsi-san">Phase 1 — TrueNAS iSCSI SAN</h2>

<p>TrueNAS is deployed as a virtual appliance directly attached to two dedicated storage network segments, in support of multipath I/O. Storage traffic is kept at Layer 2, with cluster nodes similarly attached to the same segments — no routing in the storage path.</p>

<p><strong>VM:</strong> 2 vCPU, 8GB RAM, 3 NICs (vmbr0/vmbr2/vmbr3), separate data disk for ZFS.</p>

<p><strong>Storage network interfaces:</strong></p>

<table>
  <thead>
    <tr>
      <th>NIC</th>
      <th>IP</th>
    </tr>
  </thead>
  <tbody>
    <tr>
      <td>NIC2</td>
      <td>192.168.2.1/24</td>
    </tr>
    <tr>
      <td>NIC3</td>
      <td>192.168.3.1/24</td>
    </tr>
  </tbody>
</table>

<p><strong>ZFS pool and zvol:</strong></p>
<ul>
  <li>Pool: <code class="language-plaintext highlighter-rouge">tank</code> — stripe, single disk (lab only)</li>
  <li>Zvol: <code class="language-plaintext highlighter-rouge">cluster1</code> — 20GB, sync disabled (lab), lz4 compression</li>
</ul>

<p><strong>iSCSI configuration:</strong></p>

<table>
  <thead>
    <tr>
      <th>Component</th>
      <th>Value</th>
    </tr>
  </thead>
  <tbody>
    <tr>
      <td>Portal 1</td>
      <td>192.168.2.1:3260</td>
    </tr>
    <tr>
      <td>Portal 2</td>
      <td>192.168.3.1:3260</td>
    </tr>
    <tr>
      <td>Target</td>
      <td>iqn.2005-10.org.freenas.ctl:cluster1 (auto-generated)</td>
    </tr>
    <tr>
      <td>Initiator group</td>
      <td>Allow all</td>
    </tr>
    <tr>
      <td>LUN 0</td>
      <td>zvol/tank/cluster1</td>
    </tr>
  </tbody>
</table>

<hr />

<h2 id="phase-2--rhel-node-network-configuration">Phase 2 — RHEL Node Network Configuration</h2>

<div class="language-bash highlighter-rouge"><div class="highlight"><pre class="highlight"><code><span class="c"># Storage NICs — run on each node, adjust last octet (.21 / .22)</span>
nmcli connection add <span class="nb">type </span>ethernet ifname ens19 con-name storage1 <span class="se">\</span>
    ipv4.method manual ipv4.addresses 192.168.2.21/24 <span class="se">\</span>
    ipv4.gateway <span class="s2">""</span> ipv4.dns <span class="s2">""</span> connection.autoconnect <span class="nb">yes
</span>nmcli connection up storage1

nmcli connection add <span class="nb">type </span>ethernet ifname ens20 con-name storage2 <span class="se">\</span>
    ipv4.method manual ipv4.addresses 192.168.3.21/24 <span class="se">\</span>
    ipv4.gateway <span class="s2">""</span> ipv4.dns <span class="s2">""</span> connection.autoconnect <span class="nb">yes
</span>nmcli connection up storage2
</code></pre></div></div>

<hr />

<h2 id="phase-3--iscsi-initiator-and-multipath-both-nodes">Phase 3 — iSCSI Initiator and Multipath (both nodes)</h2>

<div class="language-bash highlighter-rouge"><div class="highlight"><pre class="highlight"><code><span class="c"># Unique IQN per node</span>
<span class="nb">echo</span> <span class="s2">"InitiatorName=iqn.2024-01.com.lab:rhel1"</span> <span class="o">&gt;</span> /etc/iscsi/initiatorname.iscsi

systemctl <span class="nb">enable </span>iscsid <span class="nt">--now</span>

iscsiadm <span class="nt">-m</span> discovery <span class="nt">-t</span> sendtargets <span class="nt">-p</span> 192.168.2.1
iscsiadm <span class="nt">-m</span> discovery <span class="nt">-t</span> sendtargets <span class="nt">-p</span> 192.168.3.1

<span class="c"># Configure multipath BEFORE login</span>
mpathconf <span class="nt">--enable</span> <span class="nt">--with_multipathd</span> y

<span class="nb">cat</span> <span class="o">&gt;</span> /etc/multipath.conf <span class="o">&lt;&lt;</span> <span class="sh">'</span><span class="no">EOF</span><span class="sh">'
defaults {
    user_friendly_names yes
    find_multipaths yes
    no_path_retry "fail"
}
blacklist {
    devnode "^sda"
}
overrides {
    no_path_retry "fail"
    features "0"
}
</span><span class="no">EOF

</span>systemctl <span class="nb">enable </span>multipathd <span class="nt">--now</span>
iscsiadm <span class="nt">-m</span> node <span class="nt">--loginall</span><span class="o">=</span>automatic
systemctl <span class="nb">enable </span>iscsi <span class="nt">--now</span>
</code></pre></div></div>

<p><strong>Verified:</strong></p>
<div class="language-plaintext highlighter-rouge"><div class="highlight"><pre class="highlight"><code>mpatha (36589cfc00000069a44bab397d95776b4) dm-3 TrueNAS,iSCSI Disk
size=20G
|- sdb  active ready running
`- sdc  active ready running
</code></pre></div></div>

<p><strong>udev rule (both nodes):</strong></p>

<div class="language-bash highlighter-rouge"><div class="highlight"><pre class="highlight"><code><span class="nb">cat</span> <span class="o">&gt;</span> /etc/udev/rules.d/99-iscsi-cluster.rules <span class="o">&lt;&lt;</span> <span class="sh">'</span><span class="no">EOF</span><span class="sh">'
ENV{DM_UUID}=="mpath-36589cfc00000069a44bab397d95776b4", SYMLINK+="clusterstorage/cluster1"
</span><span class="no">EOF

</span><span class="nb">mkdir</span> <span class="nt">-p</span> /dev/clusterstorage
udevadm control <span class="nt">--reload-rules</span>
udevadm trigger <span class="nt">--subsystem-match</span><span class="o">=</span>block
</code></pre></div></div>

<p>Result: <code class="language-plaintext highlighter-rouge">/dev/clusterstorage/cluster1 → dm-3</code> ✓</p>

<hr />

<h2 id="phase-4--lvm-on-shared-storage">Phase 4 — LVM on Shared Storage</h2>

<h3 id="lvm-system_id--exclusive-activation-protection">LVM system_id — exclusive activation protection</h3>

<p><code class="language-plaintext highlighter-rouge">system_id</code> stamps the VG with the owning node’s identity. LVM refuses to
activate a VG owned by a different system_id. Pacemaker’s LVM-activate
resource agent updates the system_id during failover handoff.</p>

<div class="language-bash highlighter-rouge"><div class="highlight"><pre class="highlight"><code><span class="c"># Both nodes — set system_id source in lvm.conf</span>
<span class="nb">sed</span> <span class="nt">-i</span> <span class="s1">'s/# system_id_source = "none"/system_id_source = "uname"/'</span> <span class="se">\</span>
    /etc/lvm/lvm.conf
</code></pre></div></div>

<p><code class="language-plaintext highlighter-rouge">system_id_source = "uname"</code> uses <code class="language-plaintext highlighter-rouge">uname -n</code> (FQDN) as the system_id.</p>

<div class="language-bash highlighter-rouge"><div class="highlight"><pre class="highlight"><code><span class="c"># rhel1 only — create LVM stack</span>
pvcreate /dev/clusterstorage/cluster1
vgcreate vg-cluster1 /dev/clusterstorage/cluster1
lvcreate <span class="nt">-L</span> 18G <span class="nt">-n</span> lv-cluster1 vg-cluster1

<span class="c"># Stamp VG with rhel1's identity</span>
vgchange <span class="nt">--systemid</span> rhel1.lab5.decoursey.com vg-cluster1

<span class="c"># Format and test</span>
mkfs.xfs /dev/vg-cluster1/lv-cluster1

<span class="c"># Disable autoactivation — flag lives in shared VG metadata, propagates to all nodes</span>
vgchange <span class="nt">--setautoactivation</span> n vg-cluster1
</code></pre></div></div>

<p><strong>Do NOT add to /etc/fstab — Pacemaker owns this mount exclusively.</strong></p>

<hr />

<h2 id="phase-5--build-rhel2-and-validate-shared-storage">Phase 5 — Build rhel2 and Validate Shared Storage</h2>

<div class="language-bash highlighter-rouge"><div class="highlight"><pre class="highlight"><code><span class="c"># RHEL 9 LVM devices file — must add shared device per node</span>
lvmdevices <span class="nt">--adddev</span> /dev/clusterstorage/cluster1
pvscan <span class="nt">--cache</span> /dev/clusterstorage/cluster1
</code></pre></div></div>

<p>Failure symptom if skipped: <code class="language-plaintext highlighter-rouge">excluded by devices file (checking PVID)</code></p>

<p><strong>rhel2 protection confirmed:</strong></p>
<div class="language-plaintext highlighter-rouge"><div class="highlight"><pre class="highlight"><code>Cannot access VG vg-cluster1 with system ID rhel1.lab5.decoursey.com
with local system ID rhel2.lab5.decoursey.com.
</code></pre></div></div>

<p><strong>Post-reboot state (both nodes):</strong></p>
<div class="language-plaintext highlighter-rouge"><div class="highlight"><pre class="highlight"><code>lv-cluster1  vg-cluster1  -wi-------  18.00g
</code></pre></div></div>
<p>Not active, not open. Pacemaker owns activation exclusively. ✓</p>

<hr />

<h2 id="phase-6--pacemakercorosync-cluster">Phase 6 — Pacemaker/Corosync Cluster</h2>

<h3 id="61-install-packages-both-nodes">6.1 Install Packages (both nodes)</h3>

<div class="language-bash highlighter-rouge"><div class="highlight"><pre class="highlight"><code>subscription-manager repos <span class="nt">--enable</span><span class="o">=</span>rhel-9-for-x86_64-highavailability-rpms
dnf <span class="nb">install</span> <span class="nt">-y</span> pacemaker pcs fence-agents-all
</code></pre></div></div>

<p>Versions: pacemaker 2.1.10, pcs 0.11.10, corosync 3.1.9, fence-agents-all 4.10.0</p>

<h3 id="62-pre-cluster-setup-both-nodes">6.2 Pre-cluster Setup (both nodes)</h3>

<div class="language-bash highlighter-rouge"><div class="highlight"><pre class="highlight"><code><span class="c"># Scope high-availability ports to the peer node only — not broadly open</span>
<span class="c"># On rhel1:</span>
firewall-cmd <span class="nt">--permanent</span> <span class="nt">--add-rich-rule</span><span class="o">=</span><span class="s1">'rule family=ipv4 source address=10.0.5.22 service name=high-availability accept'</span>
<span class="c"># On rhel2:</span>
firewall-cmd <span class="nt">--permanent</span> <span class="nt">--add-rich-rule</span><span class="o">=</span><span class="s1">'rule family=ipv4 source address=10.0.5.21 service name=high-availability accept'</span>

firewall-cmd <span class="nt">--reload</span>
passwd hacluster
systemctl <span class="nb">enable </span>pcsd <span class="nt">--now</span>
</code></pre></div></div>

<h3 id="63-hostname-resolution">6.3 Hostname Resolution</h3>

<p>Required before pcs host auth — added to /etc/hosts on both nodes:</p>

<div class="language-plaintext highlighter-rouge"><div class="highlight"><pre class="highlight"><code>10.0.5.21       rhel1 rhel1.lab5.decoursey.com
10.0.5.22       rhel2 rhel2.lab5.decoursey.com
192.168.4.231   pve1 pve1.lab5.decoursey.com
192.168.4.232   pve2 pve2.lab5.decoursey.com
</code></pre></div></div>

<h3 id="64-create-cluster-rhel1-only">6.4 Create Cluster (rhel1 only)</h3>

<div class="language-bash highlighter-rouge"><div class="highlight"><pre class="highlight"><code>pcs host auth rhel1 rhel2 <span class="nt">-u</span> hacluster <span class="nt">-p</span> <span class="o">[</span>password]
pcs cluster setup mycluster rhel1 rhel2 <span class="nt">--start</span> <span class="nt">--enable</span>
</code></pre></div></div>

<h3 id="65-fence_pve-installation-both-nodes">6.5 fence_pve Installation (both nodes)</h3>

<p>fence_pve is not in RHEL fence-agents packages:</p>

<div class="language-bash highlighter-rouge"><div class="highlight"><pre class="highlight"><code>curl <span class="nt">-o</span> /usr/sbin/fence_pve <span class="se">\</span>
    https://raw.githubusercontent.com/ClusterLabs/fence-agents/main/agents/pve/fence_pve.py
<span class="nb">sed</span> <span class="nt">-i</span> <span class="s1">'s/#!@PYTHON@ -tt/#!\/usr\/bin\/python3/'</span> /usr/sbin/fence_pve
<span class="nb">chmod</span> +x /usr/sbin/fence_pve
<span class="nb">ln</span> <span class="nt">-s</span> /usr/share/fence/fencing.py /usr/lib/python3.9/site-packages/fencing.py
</code></pre></div></div>

<p>Notes: Proxmox GitHub tarball is Python 2 — do not use. Use <code class="language-plaintext highlighter-rouge">--shell-timeout=300</code>.</p>

<h3 id="66-stonith-design-and-fencing-topology">6.6 STONITH Design and Fencing Topology</h3>

<p>Each fence resource targets the hypervisor hosting the target VM — KISS.</p>

<div class="language-plaintext highlighter-rouge"><div class="highlight"><pre class="highlight"><code>fence-rhel1 → pve1    fence-rhel2 → pve2
</code></pre></div></div>

<p><strong>Delay configuration:</strong></p>

<p>In a simultaneous partition both nodes try to fence each other. Without a
tiebreaker both get fenced. <code class="language-plaintext highlighter-rouge">pcmk_delay_base</code> and <code class="language-plaintext highlighter-rouge">pcmk_delay_max</code> on
fence-rhel2 make rhel1 the designated loser — fence-rhel1 fires immediately
from rhel2, fence-rhel2 waits 15-45 seconds. rhel2 wins the fencing race
and keeps/takes resources.</p>

<div class="language-bash highlighter-rouge"><div class="highlight"><pre class="highlight"><code>pcs stonith update fence-rhel2 <span class="nv">pcmk_delay_base</span><span class="o">=</span>15s <span class="nv">pcmk_delay_max</span><span class="o">=</span>30s
</code></pre></div></div>

<p><strong>Known limitation:</strong> If pve1 or pve2 fails, fencing the VM on that
hypervisor fails and automatic failover stalls. iDRAC fencing rejected as
fallback — fences entire physical host, unacceptable blast radius. Accepted
as lab limitation. See design decisions section.</p>

<h3 id="67-stonith-resources">6.7 STONITH Resources</h3>

<div class="language-bash highlighter-rouge"><div class="highlight"><pre class="highlight"><code>pcs stonith create fence-rhel1 fence_pve <span class="se">\</span>
    <span class="nv">ip</span><span class="o">=</span>pve1.lab5.decoursey.com <span class="nv">username</span><span class="o">=</span>pacemaker@pve <span class="nv">password</span><span class="o">=[</span>password] <span class="se">\</span>
    <span class="nv">plug</span><span class="o">=</span>121 <span class="nv">ssl_insecure</span><span class="o">=</span>1 <span class="nv">pve_node_auto</span><span class="o">=</span>1 <span class="nv">vmtype</span><span class="o">=</span>qemu <span class="nv">shell_timeout</span><span class="o">=</span>300 <span class="se">\</span>
    <span class="nv">pcmk_host_list</span><span class="o">=</span>rhel1 op monitor <span class="nv">interval</span><span class="o">=</span>60s

pcs stonith create fence-rhel2 fence_pve <span class="se">\</span>
    <span class="nv">ip</span><span class="o">=</span>pve2.lab5.decoursey.com <span class="nv">username</span><span class="o">=</span>pacemaker@pve <span class="nv">password</span><span class="o">=[</span>password] <span class="se">\</span>
    <span class="nv">plug</span><span class="o">=</span>222 <span class="nv">ssl_insecure</span><span class="o">=</span>1 <span class="nv">pve_node_auto</span><span class="o">=</span>1 <span class="nv">vmtype</span><span class="o">=</span>qemu <span class="nv">shell_timeout</span><span class="o">=</span>300 <span class="se">\</span>
    <span class="nv">pcmk_delay_base</span><span class="o">=</span>15s <span class="nv">pcmk_delay_max</span><span class="o">=</span>30s <span class="se">\</span>
    <span class="nv">pcmk_host_list</span><span class="o">=</span>rhel2 op monitor <span class="nv">interval</span><span class="o">=</span>60s

pcs constraint location fence-rhel1 avoids rhel1
pcs constraint location fence-rhel2 avoids rhel2
</code></pre></div></div>

<p>Location constraints ensure each node runs the fence resource for the <em>other</em> node — correct STONITH placement.</p>

<h3 id="68-postgresql-on-shared-storage">6.8 PostgreSQL on Shared Storage</h3>

<div class="language-bash highlighter-rouge"><div class="highlight"><pre class="highlight"><code>dnf <span class="nb">install</span> <span class="nt">-y</span> postgresql-server postgresql
postgresql-setup <span class="nt">--initdb</span>
systemctl disable postgresql
firewall-cmd <span class="nt">--permanent</span> <span class="nt">--add-service</span><span class="o">=</span>postgresql
firewall-cmd <span class="nt">--reload</span>
</code></pre></div></div>

<p>postgresql.conf: <code class="language-plaintext highlighter-rouge">listen_addresses = '*'</code>, <code class="language-plaintext highlighter-rouge">port = 5432</code>
pg_hba.conf: <code class="language-plaintext highlighter-rouge">host all all 10.0.5.0/24 md5</code></p>

<p><strong>Data directory on shared storage (rhel1 only):</strong></p>

<div class="language-bash highlighter-rouge"><div class="highlight"><pre class="highlight"><code>vgchange <span class="nt">-ay</span> vg-cluster1
mount /dev/vg-cluster1/lv-cluster1 /mnt/cluster1
<span class="nb">mkdir</span> <span class="nt">-p</span> /mnt/cluster1/pgsql/data
<span class="nb">chown</span> <span class="nt">-R</span> postgres:postgres /mnt/cluster1/pgsql
<span class="nb">chmod </span>700 /mnt/cluster1/pgsql/data
<span class="nb">cp</span> <span class="nt">-a</span> /var/lib/pgsql/data/. /mnt/cluster1/pgsql/data/
umount /mnt/cluster1
vgchange <span class="nt">-an</span> vg-cluster1
</code></pre></div></div>

<h3 id="69-selinux-context-on-shared-storage">6.9 SELinux Context on Shared Storage</h3>

<p><strong>Critical:</strong> Pacemaker’s resource agents run in confined SELinux contexts.
Mount points with <code class="language-plaintext highlighter-rouge">unlabeled_t</code> cannot be traversed. Manual postgres
invocations use unconfined root context — this masks the problem.</p>

<p><strong>Diagnosis:</strong> <code class="language-plaintext highlighter-rouge">could not change directory: Permission denied</code> in pacemaker.log
despite correct Unix permissions.</p>

<p><strong>Fix:</strong></p>
<div class="language-bash highlighter-rouge"><div class="highlight"><pre class="highlight"><code><span class="nb">chcon</span> <span class="nt">-t</span> mnt_t /mnt/cluster1
<span class="nb">chcon</span> <span class="nt">-R</span> <span class="nt">-t</span> postgresql_db_t /mnt/cluster1/pgsql
</code></pre></div></div>

<p><strong>Persistence:</strong> Labels stored in XFS extended attributes on the shared
filesystem — travel with the data, survive unmount/remount on any node.
Set once, correct everywhere.</p>

<div class="language-bash highlighter-rouge"><div class="highlight"><pre class="highlight"><code>getfattr <span class="nt">-n</span> security.selinux /mnt/cluster1
<span class="c"># system_u:object_r:mnt_t:s0</span>
getfattr <span class="nt">-n</span> security.selinux /mnt/cluster1/pgsql
<span class="c"># unconfined_u:object_r:postgresql_db_t:s0</span>
</code></pre></div></div>

<p>Additional SELinux work required for monitoring is covered in section 8.7.</p>

<h3 id="610-resource-stack">6.10 Resource Stack</h3>

<div class="language-bash highlighter-rouge"><div class="highlight"><pre class="highlight"><code>pcs resource create pg-lvm LVM-activate <span class="se">\</span>
    <span class="nv">vgname</span><span class="o">=</span>vg-cluster1 <span class="nv">lvname</span><span class="o">=</span>lv-cluster1 <span class="se">\</span>
    <span class="nv">activation_mode</span><span class="o">=</span>exclusive <span class="nv">vg_access_mode</span><span class="o">=</span>system_id <span class="se">\</span>
    op monitor <span class="nv">interval</span><span class="o">=</span>30s <span class="nb">timeout</span><span class="o">=</span>30s <span class="nv">OCF_CHECK_LEVEL</span><span class="o">=</span>10

pcs resource create pg-fs Filesystem <span class="se">\</span>
    <span class="nv">device</span><span class="o">=</span>/dev/vg-cluster1/lv-cluster1 <span class="se">\</span>
    <span class="nv">directory</span><span class="o">=</span>/mnt/cluster1 <span class="nv">fstype</span><span class="o">=</span>xfs <span class="se">\</span>
    op monitor <span class="nv">interval</span><span class="o">=</span>20s

pcs resource create pg-db ocf:heartbeat:pgsql <span class="se">\</span>
    <span class="nv">pgctl</span><span class="o">=</span>/usr/bin/pg_ctl <span class="se">\</span>
    <span class="nv">pgdata</span><span class="o">=</span>/mnt/cluster1/pgsql/data <span class="se">\</span>
    op monitor <span class="nv">interval</span><span class="o">=</span>30s

pcs resource create pg-vip IPaddr2 <span class="se">\</span>
    <span class="nv">ip</span><span class="o">=</span>10.0.5.200 <span class="nv">cidr_netmask</span><span class="o">=</span>24 <span class="se">\</span>
    op monitor <span class="nv">interval</span><span class="o">=</span>10s

<span class="c"># Ordering</span>
pcs constraint order pg-lvm <span class="k">then </span>pg-fs
pcs constraint order pg-fs <span class="k">then </span>pg-db
pcs constraint order pg-db <span class="k">then </span>pg-vip

<span class="c"># Colocation</span>
pcs constraint colocation add pg-fs with pg-lvm INFINITY
pcs constraint colocation add pg-db with pg-fs INFINITY
pcs constraint colocation add pg-vip with pg-db INFINITY
</code></pre></div></div>

<h3 id="611-final-cluster-status">6.11 Final Cluster Status</h3>

<div class="language-plaintext highlighter-rouge"><div class="highlight"><pre class="highlight"><code>Full List of Resources:
  * fence-rhel1 (stonith:fence_pve):     Started rhel2
  * fence-rhel2 (stonith:fence_pve):     Started rhel1
  * pg-lvm      (ocf:heartbeat:LVM-activate):    Started rhel1
  * pg-fs       (ocf:heartbeat:Filesystem):      Started rhel1
  * pg-vip      (ocf:heartbeat:IPaddr2):         Started rhel1
  * pg-db       (ocf:heartbeat:pgsql):   Started rhel1
</code></pre></div></div>

<p>No errors. No warnings. ✓</p>

<hr />

<h2 id="phase-7--failure-scenario-validation">Phase 7 — Failure Scenario Validation</h2>

<blockquote>
  <p>This cluster was validated against four distinct failure scenarios
representing different failure classes. Testing was not limited to
the happy path — the goal was to exercise the full range of conditions
a production HA implementation must handle correctly.</p>
</blockquote>

<hr />

<table>
  <thead>
    <tr>
      <th>#</th>
      <th>Scenario</th>
      <th>Failure Class</th>
      <th>STONITH Fires</th>
      <th>Recovery</th>
      <th>Disruption</th>
    </tr>
  </thead>
  <tbody>
    <tr>
      <td>1</td>
      <td>Graceful migration (<code class="language-plaintext highlighter-rouge">pcs node standby</code>)</td>
      <td>Planned maintenance</td>
      <td>No</td>
      <td>Automatic</td>
      <td>~7 sec</td>
    </tr>
    <tr>
      <td>2a</td>
      <td>Corosync partition — active node partitioned</td>
      <td>Split-brain risk</td>
      <td><strong>Yes</strong></td>
      <td>Automatic</td>
      <td>~16 sec</td>
    </tr>
    <tr>
      <td>2b</td>
      <td>Corosync partition — standby node partitioned</td>
      <td>Split-brain risk</td>
      <td><strong>Yes</strong></td>
      <td>No disruption</td>
      <td>0 sec</td>
    </tr>
    <tr>
      <td>3</td>
      <td>Hard VM power off (Proxmox Stop)</td>
      <td>Hardware/hypervisor failure</td>
      <td><strong>Yes</strong></td>
      <td>Automatic</td>
      <td>~65 sec</td>
    </tr>
    <tr>
      <td>4</td>
      <td>PostgreSQL process kill (<code class="language-plaintext highlighter-rouge">kill -9</code>)</td>
      <td>Application crash</td>
      <td>No</td>
      <td>Automatic (in-place restart)</td>
      <td>~11 sec</td>
    </tr>
  </tbody>
</table>

<hr />

<h3 id="test-setup">Test Setup</h3>

<p>PostgreSQL test table and timestamped write loop used across all scenarios:</p>

<div class="language-bash highlighter-rouge"><div class="highlight"><pre class="highlight"><code>psql <span class="nt">-h</span> 10.0.5.200 <span class="nt">-U</span> postgres <span class="nt">-d</span> clustertest <span class="se">\</span>
    <span class="nt">-c</span> <span class="s2">"CREATE TABLE failover_test (id serial, ts timestamp);"</span>

<span class="nb">echo</span> <span class="s2">"10.0.5.200:5432:*:postgres:[password]"</span> <span class="o">&gt;</span> ~/.pgpass
<span class="nb">chmod </span>600 ~/.pgpass

<span class="k">while </span><span class="nb">true</span><span class="p">;</span> <span class="k">do
    </span><span class="nv">result</span><span class="o">=</span><span class="si">$(</span>psql <span class="nt">-h</span> 10.0.5.200 <span class="nt">-U</span> postgres <span class="nt">-d</span> clustertest <span class="se">\</span>
        <span class="nt">-c</span> <span class="s2">"INSERT INTO failover_test (ts) VALUES (now());"</span> 2&gt;&amp;1<span class="si">)</span>
    <span class="nb">echo</span> <span class="s2">"</span><span class="si">$(</span><span class="nb">date</span> +%H:%M:%S<span class="si">)</span><span class="s2"> </span><span class="nv">$result</span><span class="s2">"</span>
    <span class="nb">sleep </span>1
<span class="k">done</span>
</code></pre></div></div>

<p>Timestamps make the disruption window precisely measurable. The write loop
client was always run from the node not holding resources so that client
process survival was independent of the failover.</p>

<hr />

<h3 id="scenario-1--graceful-migration">Scenario 1 — Graceful Migration</h3>

<p><strong>What was tested:</strong> <code class="language-plaintext highlighter-rouge">pcs node standby rhel2</code> with resources running on rhel2.
Ordered shutdown and migration of all resources to rhel1.</p>

<p><strong>Why it matters:</strong> Planned maintenance — patching, reboots, upgrades. The
most common operational use of a cluster.</p>

<p><strong>Result:</strong></p>
<div class="language-plaintext highlighter-rouge"><div class="highlight"><pre class="highlight"><code>05:49:34  INSERT 0 1   ← last write on rhel2
05:49:38  No route to host
05:49:41  No route to host
05:49:42  INSERT 0 1   ← resumed on rhel1
</code></pre></div></div>

<p>7 second disruption. Orderly stop/start sequence. No STONITH. No data loss.
109 rows confirmed intact after migration. ✓</p>

<hr />

<h3 id="scenario-2--corosync-partition-split-brain-risk">Scenario 2 — Corosync Partition (Split-Brain Risk)</h3>

<p><strong>What was tested:</strong> iptables rules blocking UDP port 5405 (corosync) between
nodes. This simulates a network partition where both nodes are running but
cannot see each other — the classic split-brain scenario that STONITH exists
to prevent.</p>

<p><strong>Why it matters:</strong> This is the scenario where data corruption is possible
without proper fencing. Both nodes might believe they are the sole survivor
and attempt to mount the same filesystem simultaneously. STONITH eliminates
this risk by guaranteeing one node is dead before the other acts.</p>

<p><strong>Tiebreaker configuration:</strong> Initial testing confirmed the mutual fencing scenario directly — both VMs powered off simultaneously. The delay configuration described in section 6.6 was added as a result and validated here.</p>

<p><strong>Scenario 2a — Active node partitioned (resources on rhel1, rhel1 firewalled):</strong></p>

<div class="language-bash highlighter-rouge"><div class="highlight"><pre class="highlight"><code><span class="c"># On rhel1</span>
iptables <span class="nt">-I</span> INPUT <span class="nt">-s</span> 10.0.5.22 <span class="nt">-p</span> udp <span class="nt">--dport</span> 5405 <span class="nt">-j</span> DROP
iptables <span class="nt">-I</span> OUTPUT <span class="nt">-d</span> 10.0.5.22 <span class="nt">-p</span> udp <span class="nt">--dport</span> 5405 <span class="nt">-j</span> DROP
</code></pre></div></div>

<p>rhel2 lost contact with rhel1, fired fence-rhel1 immediately. rhel1 rebooted
via pve1 API. Resources migrated to rhel2. rhel1’s reboot cleared the iptables
rules — rhel1 rejoined cluster cleanly on boot.</p>

<p>Write loop output:</p>
<div class="language-plaintext highlighter-rouge"><div class="highlight"><pre class="highlight"><code>05:49:02  INSERT 0 1   ← last write before partition
05:49:18  INSERT 0 1   ← resumed after rhel1 fenced and rhel2 took over
</code></pre></div></div>

<p>16 second disruption. STONITH fired. Resources migrated. Cluster self-healed. ✓</p>

<p><strong>Scenario 2b — Standby node partitioned (resources on rhel2, rhel2 firewalled):</strong></p>

<div class="language-bash highlighter-rouge"><div class="highlight"><pre class="highlight"><code><span class="c"># On rhel2</span>
iptables <span class="nt">-I</span> INPUT <span class="nt">-s</span> 10.0.5.21 <span class="nt">-p</span> udp <span class="nt">--dport</span> 5405 <span class="nt">-j</span> DROP
iptables <span class="nt">-I</span> OUTPUT <span class="nt">-d</span> 10.0.5.21 <span class="nt">-p</span> udp <span class="nt">--dport</span> 5405 <span class="nt">-j</span> DROP
</code></pre></div></div>

<p>rhel1 lost contact with rhel2. Fired fence-rhel2 immediately. rhel2 rebooted.
Resources stayed on rhel2 throughout — rhel2 had quorum and the service never
stopped. Write loop showed zero disruption.</p>

<p><strong>Key insight:</strong> The surviving node simultaneously keeps the service running
and reboots its partner — even if the partner was merely standby — to attempt
automatic restoration of full redundancy. The goal is not just surviving the
failure but returning to a healthy two-node cluster as quickly as possible.</p>

<p><strong>On quorum and post-reboot behavior:</strong> When a fenced node reboots it starts
corosync, sees it has only 1 of 2 votes (no quorum), and waits. It does not
attempt to start resources or initiate fencing. It will not shoot back at the
surviving node. Pacemaker’s quorum requirement is what prevents the rebooted
node from causing further disruption. ✓</p>

<hr />

<h3 id="scenario-3--hard-vm-power-off">Scenario 3 — Hard VM Power Off</h3>

<p><strong>What was tested:</strong> Resources on rhel2. rhel2 hard-stopped from Proxmox UI
(Stop — equivalent to pulling the power cord, no graceful shutdown).</p>

<p><strong>Why it matters:</strong> Kernel panic, hypervisor crash, physical power failure.
No graceful corosync goodbye — the node simply vanishes.</p>

<p><strong>Result:</strong></p>
<div class="language-plaintext highlighter-rouge"><div class="highlight"><pre class="highlight"><code>05:56:58  INSERT 0 1   ← last write before hard power off
05:58:03  INSERT 0 1   ← resumed after recovery
</code></pre></div></div>

<p>65 second disruption — longest of all scenarios. The primary driver is the
<code class="language-plaintext highlighter-rouge">pcmk_delay_base=15s pcmk_delay_max=30s</code> configured on fence-rhel2. When
rhel2 disappeared, rhel1 needed to fence rhel2 before taking over resources
— but fence-rhel2 carries the delay, so rhel1 had to wait it out before
firing. Once STONITH confirmed rhel2 was already off, resources migrated to
rhel1 normally.</p>

<p>rhel2 rejoined the cluster after STONITH-driven reboot, restoring full redundancy automatically. ✓</p>

<hr />

<h3 id="scenario-4--postgresql-process-kill">Scenario 4 — PostgreSQL Process Kill</h3>

<p><strong>What was tested:</strong> Resources on rhel1. PostgreSQL master process killed
with <code class="language-plaintext highlighter-rouge">kill -9 $(pgrep -f "postgres -D")</code> while write loop running from rhel2.</p>

<p><strong>Why it matters:</strong> Application crash — segfault, OOM kill of the
database process, runaway resource consumption. Node is healthy but the
service is down.</p>

<p><strong>Result:</strong></p>
<div class="language-plaintext highlighter-rouge"><div class="highlight"><pre class="highlight"><code>06:02:21  INSERT 0 1        ← last write before kill -9
06:02:22  Connection refused ← postgres dead
06:02:23  Connection refused
06:02:24  Connection refused
06:02:32  INSERT 0 1        ← postgres restarted in place
</code></pre></div></div>

<p>11 second disruption — fastest of all scenarios. No STONITH. No resource
migration. No storage handoff. Pacemaker’s 30-second monitor interval fired
at 06:02:24, detected postgres not running, restarted it in place on rhel1.
VIP never moved. LVM and filesystem never touched.</p>

<p>The pcs status retained a failed action record after recovery:</p>
<div class="language-plaintext highlighter-rouge"><div class="highlight"><pre class="highlight"><code>Failed Resource Actions:
  * pg-db 30s-interval monitor on rhel1 returned 'not running'
</code></pre></div></div>

<p>This is expected — Pacemaker records the event in history but the service
is running normally. Clear with <code class="language-plaintext highlighter-rouge">pcs resource cleanup pg-db</code>. In production
this record should trigger an alert — the cluster self-healed but the root
cause of the crash still needs investigation.</p>

<p>This distinction matters: a monitor failure triggers service restart on the
same node. A start failure after restart triggers migration to the other node.
STONITH is reserved for node-level failures where the node’s state is unknown. ✓</p>

<hr />

<h3 id="validation-summary">Validation Summary</h3>

<p>All four failure classes tested. All recovered automatically without manual
intervention. No data loss in any scenario.</p>

<p>The disruption times tell a story about the recovery path:</p>

<ul>
  <li><strong>11 seconds</strong> — application crash (in-place restart, no infrastructure change)</li>
  <li><strong>7 seconds</strong> — graceful migration (ordered handoff, no uncertainty)</li>
  <li><strong>16 seconds</strong> — network partition (corosync timeout + STONITH + migration)</li>
  <li><strong>65 seconds</strong> — hard power off (longer corosync timeout + STONITH + migration)</li>
</ul>

<p><strong>Alerting consideration:</strong> The cluster self-healed in all scenarios. Per
the design philosophy — if failover works, you won’t see an outage. But you
still need to know it happened. Pacemaker logs all state transitions and
failed resource actions. These should feed into a monitoring system so the
operations team is notified even when the impact to users was minimal or zero.
The absence of an outage is not the same as the absence of a problem.</p>

<hr />

<h2 id="phase-8--monitoring-and-alerting">Phase 8 — Monitoring and Alerting</h2>

<h3 id="81-monitoring-architecture">8.1 Monitoring Architecture</h3>

<p><strong>The Research Gap</strong> Initial research into Pacemaker/Nagios integration confirmed a lack of official, “out-of-the-box” tooling. The established community standard relies on deploying NRPE to cluster nodes and using custom wrapper scripts to parse <code class="language-plaintext highlighter-rouge">crm_mon</code> output. While we successfully implemented and validated this polling method, it revealed a significant architectural limitation.</p>

<p><strong>The Polling Limitation</strong> Because Pacemaker is designed to detect and resolve failures within seconds, a standard polling interval (e.g., 60 seconds) only captures the instantaneous state of the cluster. This creates a “blind spot” where transient but critical events — such as resource restarts or fencing (STONITH) actions — can occur and resolve entirely between polls, leaving Nagios unaware of the underlying instability.</p>

<p><strong>The Integrated Solution</strong> To bridge this gap, we moved beyond simple polling to implement a dual-layer monitoring strategy. This involves leveraging Pacemaker’s native Alert Agent mechanism to provide real-time, event-driven notifications.</p>

<p>Two distinct monitoring mechanisms are therefore in place:</p>

<p><strong>Active polling</strong> — Nagios polls cluster nodes on a regular interval via NRPE,
running a check script that parses <code class="language-plaintext highlighter-rouge">crm_mon</code> output. This catches persistent
problems: a node that is offline and stays offline, a resource that fails and
does not recover, a cluster that has lost quorum. It does not catch transient
events that resolve before the next poll.</p>

<p><strong>Event-driven passive checks</strong> — Pacemaker fires an alert agent script on every
state change event. The script submits a passive check result to Nagios immediately
via NSCA-ng, with no polling involved. This catches everything the polling
misses: node offline, STONITH fired, node rejoined, resource failed and recovered.
The event appears in Nagios within seconds regardless of the polling interval.</p>

<h3 id="82-components-deployed">8.2 Components Deployed</h3>

<p><strong>On the Nagios monitoring host (10.0.5.12):</strong></p>

<table>
  <thead>
    <tr>
      <th>Component</th>
      <th>Package</th>
      <th>Purpose</th>
    </tr>
  </thead>
  <tbody>
    <tr>
      <td>Nagios Core</td>
      <td>nagios (EPEL)</td>
      <td>Monitoring engine and web UI</td>
    </tr>
    <tr>
      <td>NRPE plugin</td>
      <td>nagios-plugins-nrpe (EPEL)</td>
      <td>Client for executing remote checks</td>
    </tr>
    <tr>
      <td>PostgreSQL plugin</td>
      <td>nagios-plugins-pgsql (EPEL)</td>
      <td>Direct PostgreSQL connectivity check</td>
    </tr>
    <tr>
      <td>NSCA-ng server</td>
      <td>nsca-ng-server (EPEL)</td>
      <td>Receives passive check results from cluster nodes</td>
    </tr>
  </tbody>
</table>

<p><strong>On both cluster nodes (rhel1, rhel2):</strong></p>

<table>
  <thead>
    <tr>
      <th>Component</th>
      <th>Package/File</th>
      <th>Purpose</th>
    </tr>
  </thead>
  <tbody>
    <tr>
      <td>NRPE daemon</td>
      <td>nrpe (EPEL)</td>
      <td>Executes check commands on behalf of Nagios</td>
    </tr>
    <tr>
      <td>Standard plugins</td>
      <td>nagios-plugins-disk, nagios-plugins-load (EPEL)</td>
      <td>Disk and load checks</td>
    </tr>
    <tr>
      <td>NSCA-ng client</td>
      <td>nsca-ng-client (EPEL)</td>
      <td>Submits passive check results to Nagios</td>
    </tr>
    <tr>
      <td>check_pacemaker</td>
      <td>/usr/lib64/nagios/plugins/check_pacemaker</td>
      <td>Custom script — parses crm_mon output</td>
    </tr>
    <tr>
      <td>alert_nsca.sh</td>
      <td>/usr/share/pacemaker/alerts/alert_nsca.sh</td>
      <td>Pacemaker alert agent</td>
    </tr>
    <tr>
      <td>nrpe-pacemaker</td>
      <td>/etc/sudoers.d/nrpe-pacemaker</td>
      <td>Allows nrpe to run crm_mon via sudo</td>
    </tr>
    <tr>
      <td>send_nsca.cfg</td>
      <td>/etc/send_nsca.cfg</td>
      <td>NSCA-ng client configuration</td>
    </tr>
  </tbody>
</table>

<p><strong>Firewall rules added on cluster nodes:</strong></p>

<div class="language-bash highlighter-rouge"><div class="highlight"><pre class="highlight"><code><span class="c"># NRPE — allow from Nagios host only</span>
firewall-cmd <span class="nt">--permanent</span> <span class="nt">--add-rich-rule</span><span class="o">=</span><span class="s1">'rule family=ipv4 source address=10.0.5.12 port port=5666 protocol=tcp accept'</span>
firewall-cmd <span class="nt">--reload</span>
</code></pre></div></div>

<p><strong>Firewall rules added on Nagios host:</strong></p>

<div class="language-bash highlighter-rouge"><div class="highlight"><pre class="highlight"><code><span class="c"># NSCA-ng — allow from cluster network</span>
firewall-cmd <span class="nt">--permanent</span> <span class="nt">--add-rich-rule</span><span class="o">=</span><span class="s1">'rule family=ipv4 source address=10.0.5.0/24 port port=5668 protocol=tcp accept'</span>
firewall-cmd <span class="nt">--reload</span>
</code></pre></div></div>

<h3 id="83-active-polling-checks">8.3 Active Polling Checks</h3>

<p>All active checks run from the Nagios host via NRPE or direct network connection:</p>

<table>
  <thead>
    <tr>
      <th>Service</th>
      <th>Host</th>
      <th>Method</th>
      <th>What It Catches</th>
    </tr>
  </thead>
  <tbody>
    <tr>
      <td>Pacemaker Status</td>
      <td>rhel1, rhel2</td>
      <td>NRPE → check_pacemaker</td>
      <td>Node offline, resource failed, no quorum, fail-count</td>
    </tr>
    <tr>
      <td>Disk /</td>
      <td>rhel1, rhel2</td>
      <td>NRPE → check_disk</td>
      <td>Filesystem usage threshold</td>
    </tr>
    <tr>
      <td>Load</td>
      <td>rhel1, rhel2</td>
      <td>NRPE → check_load</td>
      <td>CPU load average threshold</td>
    </tr>
    <tr>
      <td>PostgreSQL</td>
      <td>cluster-vip</td>
      <td>Direct → check_pgsql</td>
      <td>Database connectivity via floating VIP</td>
    </tr>
  </tbody>
</table>

<p><strong>Note:</strong> The PostgreSQL check runs directly from the Nagios host against the floating VIP — testing reachability, connectivity, and authentication from a hypothetical external client’s perspective rather than from within the cluster.</p>

<p><strong>NRPE commands defined in /etc/nagios/nrpe.cfg (both nodes):</strong></p>

<div class="language-plaintext highlighter-rouge"><div class="highlight"><pre class="highlight"><code>command[check_disk]=/usr/lib64/nagios/plugins/check_disk -w 20% -c 10% -p /
command[check_load]=/usr/lib64/nagios/plugins/check_load -r -w .15,.10,.05 -c .30,.25,.20
command[check_pacemaker]=/usr/lib64/nagios/plugins/check_pacemaker -w
</code></pre></div></div>

<h3 id="84-check_pacemaker">8.4 check_pacemaker</h3>

<p>No suitable pre-packaged Nagios plugin existed for Pacemaker cluster health on
RHEL 9. The <code class="language-plaintext highlighter-rouge">check_crm</code> Perl script (Sysnix Consultants, 2011) requires
<code class="language-plaintext highlighter-rouge">Nagios::Plugin</code> which is not available in EPEL. The script itself was widely
referenced in its era and covered the relevant cases thoughtfully — standby
detection, fail-count, fence resource suppression. On the reasonable presumption
that its design was well-informed, a bash equivalent was written to the same
specification rather than approaching the problem from scratch.</p>

<p>The script runs <code class="language-plaintext highlighter-rouge">sudo /usr/sbin/crm_mon -1 -r -f</code> and parses the output for:</p>

<ul>
  <li>Loss of quorum</li>
  <li>Offline nodes (reported by name)</li>
  <li>Nodes in standby (WARNING with <code class="language-plaintext highlighter-rouge">-w</code> flag, CRITICAL otherwise)</li>
  <li>Stopped non-fence resources (fence resources stopping when their host goes
offline is expected behavior, suppressed to avoid misleading output)</li>
  <li>Failed resource actions</li>
  <li>Resources with non-zero fail-count</li>
</ul>

<p>The <code class="language-plaintext highlighter-rouge">-w</code> flag is used in the NRPE command definition — standby is a valid
operational state (planned maintenance) and should not page on-call.</p>

<div class="language-bash highlighter-rouge"><div class="highlight"><pre class="highlight"><code><span class="c">#!/bin/bash</span>
<span class="c">#</span>
<span class="c"># check_pacemaker - Nagios check for Pacemaker cluster health</span>
<span class="c"># Parses crm_mon output and reports cluster state</span>
<span class="c">#</span>
<span class="c"># Exit codes: 0=OK, 1=WARNING, 2=CRITICAL</span>
<span class="c">#</span>
<span class="c"># Usage: check_pacemaker [-w]</span>
<span class="c">#   -w  Treat offline nodes, stopped resources, and standby nodes as</span>
<span class="c">#       WARNING instead of CRITICAL (as long as quorum exists)</span>
<span class="c">#</span>

<span class="nv">WARN_ONLY</span><span class="o">=</span>0
<span class="k">while </span><span class="nb">getopts</span> <span class="s2">"w"</span> opt<span class="p">;</span> <span class="k">do
    case</span> <span class="nv">$opt</span> <span class="k">in
        </span>w<span class="p">)</span> <span class="nv">WARN_ONLY</span><span class="o">=</span>1 <span class="p">;;</span>
    <span class="k">esac</span>
<span class="k">done

</span><span class="nv">WARN_OR_CRIT</span><span class="o">=</span>2
<span class="o">[</span> <span class="nv">$WARN_ONLY</span> <span class="nt">-eq</span> 1 <span class="o">]</span> <span class="o">&amp;&amp;</span> <span class="nv">WARN_OR_CRIT</span><span class="o">=</span>1

<span class="nv">CRM_MON</span><span class="o">=</span>/usr/sbin/crm_mon
<span class="nv">SUDO</span><span class="o">=</span>/usr/bin/sudo

<span class="nv">OUTPUT</span><span class="o">=</span><span class="si">$(</span><span class="nv">$SUDO</span> <span class="nv">$CRM_MON</span> <span class="nt">-1</span> <span class="nt">-r</span> <span class="nt">-f</span> 2&gt;&amp;1<span class="si">)</span>
<span class="k">if</span> <span class="o">[</span> <span class="nv">$?</span> <span class="nt">-ne</span> 0 <span class="o">]</span><span class="p">;</span> <span class="k">then
    </span><span class="nb">echo</span> <span class="s2">"CRITICAL: Failed to run crm_mon"</span>
    <span class="nb">exit </span>2
<span class="k">fi

</span><span class="nv">WORST</span><span class="o">=</span>0
<span class="nv">MESSAGES</span><span class="o">=()</span>

<span class="k">if </span><span class="nb">echo</span> <span class="s2">"</span><span class="nv">$OUTPUT</span><span class="s2">"</span> | <span class="nb">grep</span> <span class="nt">-qi</span> <span class="s2">"connection to cluster failed"</span><span class="p">;</span> <span class="k">then
    </span><span class="nb">echo</span> <span class="s2">"CRITICAL: Connection to cluster failed"</span>
    <span class="nb">exit </span>2
<span class="k">fi

if </span><span class="nb">echo</span> <span class="s2">"</span><span class="nv">$OUTPUT</span><span class="s2">"</span> | <span class="nb">grep</span> <span class="nt">-q</span> <span class="s2">"Current DC:"</span><span class="p">;</span> <span class="k">then
    if</span> <span class="o">!</span> <span class="nb">echo</span> <span class="s2">"</span><span class="nv">$OUTPUT</span><span class="s2">"</span> | <span class="nb">grep</span> <span class="nt">-q</span> <span class="s2">"partition with quorum$"</span><span class="p">;</span> <span class="k">then
        </span>MESSAGES+<span class="o">=(</span><span class="s2">"No Quorum"</span><span class="o">)</span>
        <span class="nv">WORST</span><span class="o">=</span>2
    <span class="k">fi
fi

</span><span class="nv">OFFLINE</span><span class="o">=</span><span class="si">$(</span><span class="nb">echo</span> <span class="s2">"</span><span class="nv">$OUTPUT</span><span class="s2">"</span> | <span class="nb">grep</span> <span class="nt">-i</span> <span class="s2">"^</span><span class="se">\s</span><span class="s2">*</span><span class="se">\*\s</span><span class="s2">*OFFLINE:"</span> | <span class="nb">grep</span> <span class="nt">-oP</span> <span class="s1">'\[.*?\]'</span> | <span class="nb">tr</span> <span class="nt">-d</span> <span class="s1">'[]'</span><span class="si">)</span>
<span class="k">if</span> <span class="o">[</span> <span class="nt">-n</span> <span class="s2">"</span><span class="nv">$OFFLINE</span><span class="s2">"</span> <span class="o">]</span><span class="p">;</span> <span class="k">then
    </span>MESSAGES+<span class="o">=(</span><span class="s2">"Node(s) OFFLINE:</span><span class="nv">$OFFLINE</span><span class="s2">"</span><span class="o">)</span>
    <span class="o">[</span> <span class="nv">$WARN_OR_CRIT</span> <span class="nt">-gt</span> <span class="nv">$WORST</span> <span class="o">]</span> <span class="o">&amp;&amp;</span> <span class="nv">WORST</span><span class="o">=</span><span class="nv">$WARN_OR_CRIT</span>
<span class="k">fi

</span><span class="nv">STANDBY</span><span class="o">=</span><span class="si">$(</span><span class="nb">echo</span> <span class="s2">"</span><span class="nv">$OUTPUT</span><span class="s2">"</span> | <span class="nb">grep</span> <span class="nt">-i</span> <span class="s2">"^node.*standby"</span> | <span class="nb">awk</span> <span class="s1">'{print $2}'</span> | <span class="nb">tr</span> <span class="s1">'
'</span> <span class="s1">' '</span><span class="si">)</span>
<span class="k">if</span> <span class="o">[</span> <span class="nt">-n</span> <span class="s2">"</span><span class="nv">$STANDBY</span><span class="s2">"</span> <span class="o">]</span><span class="p">;</span> <span class="k">then
    </span>MESSAGES+<span class="o">=(</span><span class="s2">"Node(s) in standby: </span><span class="nv">$STANDBY</span><span class="s2">"</span><span class="o">)</span>
    <span class="o">[</span> <span class="nv">$WARN_OR_CRIT</span> <span class="nt">-gt</span> <span class="nv">$WORST</span> <span class="o">]</span> <span class="o">&amp;&amp;</span> <span class="nv">WORST</span><span class="o">=</span><span class="nv">$WARN_OR_CRIT</span>
<span class="k">fi

</span><span class="nv">STOPPED</span><span class="o">=</span><span class="si">$(</span><span class="nb">echo</span> <span class="s2">"</span><span class="nv">$OUTPUT</span><span class="s2">"</span> | <span class="nb">grep</span> <span class="nt">-E</span> <span class="s1">'\(.*\).*Stopped'</span> | <span class="nb">grep</span> <span class="nt">-v</span> <span class="s1">'fence'</span> | <span class="nb">awk</span> <span class="s1">'{print $2}'</span> | <span class="nb">tr</span> <span class="s1">'
'</span> <span class="s1">' '</span><span class="si">)</span>
<span class="k">if</span> <span class="o">[</span> <span class="nt">-n</span> <span class="s2">"</span><span class="nv">$STOPPED</span><span class="s2">"</span> <span class="o">]</span><span class="p">;</span> <span class="k">then
    </span>MESSAGES+<span class="o">=(</span><span class="s2">"Stopped resources: </span><span class="nv">$STOPPED</span><span class="s2">"</span><span class="o">)</span>
    <span class="o">[</span> <span class="nv">$WARN_OR_CRIT</span> <span class="nt">-gt</span> <span class="nv">$WORST</span> <span class="o">]</span> <span class="o">&amp;&amp;</span> <span class="nv">WORST</span><span class="o">=</span><span class="nv">$WARN_OR_CRIT</span>
<span class="k">fi

if </span><span class="nb">echo</span> <span class="s2">"</span><span class="nv">$OUTPUT</span><span class="s2">"</span> | <span class="nb">grep</span> <span class="nt">-q</span> <span class="s2">"^Failed actions:"</span><span class="p">;</span> <span class="k">then
    </span>MESSAGES+<span class="o">=(</span><span class="s2">"FAILED actions detected or not cleaned up"</span><span class="o">)</span>
    <span class="o">[</span> 2 <span class="nt">-gt</span> <span class="nv">$WORST</span> <span class="o">]</span> <span class="o">&amp;&amp;</span> <span class="nv">WORST</span><span class="o">=</span>2
<span class="k">fi

</span><span class="nv">FAILCOUNT</span><span class="o">=</span><span class="si">$(</span><span class="nb">echo</span> <span class="s2">"</span><span class="nv">$OUTPUT</span><span class="s2">"</span> | <span class="nb">grep</span> <span class="s1">'fail-count=[1-9]'</span> | <span class="nb">awk</span> <span class="s1">'{print $2}'</span> | <span class="nb">tr</span> <span class="nt">-d</span> <span class="s1">':'</span> | <span class="nb">tr</span> <span class="s1">'
'</span> <span class="s1">' '</span><span class="si">)</span>
<span class="k">if</span> <span class="o">[</span> <span class="nt">-n</span> <span class="s2">"</span><span class="nv">$FAILCOUNT</span><span class="s2">"</span> <span class="o">]</span><span class="p">;</span> <span class="k">then
    </span>MESSAGES+<span class="o">=(</span><span class="s2">"Failure detected on: </span><span class="nv">$FAILCOUNT</span><span class="s2">"</span><span class="o">)</span>
    <span class="o">[</span> 1 <span class="nt">-gt</span> <span class="nv">$WORST</span> <span class="o">]</span> <span class="o">&amp;&amp;</span> <span class="nv">WORST</span><span class="o">=</span>1
<span class="k">fi</span>

<span class="o">[</span> <span class="k">${#</span><span class="nv">MESSAGES</span><span class="p">[@]</span><span class="k">}</span> <span class="nt">-eq</span> 0 <span class="o">]</span> <span class="o">&amp;&amp;</span> MESSAGES+<span class="o">=(</span><span class="s2">"Cluster OK"</span><span class="o">)</span>

<span class="nv">MSG</span><span class="o">=</span><span class="si">$(</span><span class="nv">IFS</span><span class="o">=</span><span class="s1">', '</span><span class="p">;</span> <span class="nb">echo</span> <span class="s2">"</span><span class="k">${</span><span class="nv">MESSAGES</span><span class="p">[*]</span><span class="k">}</span><span class="s2">"</span><span class="si">)</span>
<span class="k">case</span> <span class="nv">$WORST</span> <span class="k">in
    </span>0<span class="p">)</span> <span class="nb">echo</span> <span class="s2">"OK: </span><span class="nv">$MSG</span><span class="s2">"</span> <span class="p">;;</span>
    1<span class="p">)</span> <span class="nb">echo</span> <span class="s2">"WARNING: </span><span class="nv">$MSG</span><span class="s2">"</span> <span class="p">;;</span>
    2<span class="p">)</span> <span class="nb">echo</span> <span class="s2">"CRITICAL: </span><span class="nv">$MSG</span><span class="s2">"</span> <span class="p">;;</span>
<span class="k">esac</span>
<span class="nb">exit</span> <span class="nv">$WORST</span>
</code></pre></div></div>

<p><strong>sudo configuration (both nodes):</strong></p>

<div class="language-bash highlighter-rouge"><div class="highlight"><pre class="highlight"><code><span class="c"># /etc/sudoers.d/nrpe-pacemaker</span>
Defaults:nrpe <span class="o">!</span>requiretty
Defaults:nrpe <span class="nv">timestamp_timeout</span><span class="o">=</span>0
nrpe <span class="nv">ALL</span><span class="o">=(</span>root<span class="o">)</span> NOPASSWD: /usr/sbin/crm_mon
</code></pre></div></div>

<h3 id="85-event-driven-alerting">8.5 Event-Driven Alerting</h3>

<p>The more complete integration. Pacemaker has native support for external
notification via what it calls alert agents — scripts it executes on every
state change event, passing event details as environment variables. The agent
can take any action; here it submits a passive check result to Nagios via
NSCA-ng, a secure authenticated channel for delivering check results without
polling.</p>

<p><strong>Pipeline:</strong></p>
<div class="language-plaintext highlighter-rouge"><div class="highlight"><pre class="highlight"><code>Pacemaker state change
  → alert_nsca.sh (alert agent, runs on cluster node)
    → send_nsca (NSCA-ng client)
      → nsca-ng (NSCA-ng server on Nagios host, port 5668)
        → Nagios command pipe
          → Nagios passive check result
</code></pre></div></div>

<p><strong>Alert agent registered with Pacemaker:</strong></p>

<div class="language-bash highlighter-rouge"><div class="highlight"><pre class="highlight"><code>pcs alert create <span class="nb">id</span><span class="o">=</span>nsca-alert <span class="nv">path</span><span class="o">=</span>/usr/share/pacemaker/alerts/alert_nsca.sh
pcs alert recipient add nsca-alert <span class="nb">id</span><span class="o">=</span>nsca-recipient <span class="nv">value</span><span class="o">=</span>nagios
</code></pre></div></div>

<p>The alert agent fires on node events, resource events, and fencing events.
Results are submitted against the <code class="language-plaintext highlighter-rouge">Pacemaker Events</code> passive service on the
node the event concerns — not necessarily the node submitting the result.
When rhel1 reports that rhel2 is offline, Nagios correctly marks rhel2’s
<code class="language-plaintext highlighter-rouge">Pacemaker Events</code> service as CRITICAL.</p>

<p><strong>NSCA-ng server configuration (/etc/nsca-ng.cfg on Nagios host):</strong></p>

<div class="language-plaintext highlighter-rouge"><div class="highlight"><pre class="highlight"><code>command_file = "/var/spool/nagios/cmd/nagios.cmd"

authorize "*" {
    password = "[password]"
    hosts = ".*"
    services = ".*"
}
</code></pre></div></div>

<p><strong>NSCA-ng client configuration (/etc/send_nsca.cfg on cluster nodes):</strong></p>

<div class="language-plaintext highlighter-rouge"><div class="highlight"><pre class="highlight"><code>server = "10.0.5.12"
port = "5668"
password = "[password]"
</code></pre></div></div>

<h3 id="86-alert_nscash">8.6 alert_nsca.sh</h3>

<p>Pacemaker injects event details as environment variables before invoking the
alert agent. Key variables used:</p>

<table>
  <thead>
    <tr>
      <th>Variable</th>
      <th>Content</th>
    </tr>
  </thead>
  <tbody>
    <tr>
      <td>CRM_alert_kind</td>
      <td>Event type: node, resource, fencing</td>
    </tr>
    <tr>
      <td>CRM_alert_node</td>
      <td>Node where event occurred</td>
    </tr>
    <tr>
      <td>CRM_alert_desc</td>
      <td>Human-readable state: member, lost, standby</td>
    </tr>
    <tr>
      <td>CRM_alert_rsc</td>
      <td>Resource name (resource events)</td>
    </tr>
    <tr>
      <td>CRM_alert_task</td>
      <td>Action: start, stop, monitor (resource events)</td>
    </tr>
    <tr>
      <td>CRM_alert_rc</td>
      <td>Return code — non-zero indicates failure</td>
    </tr>
    <tr>
      <td>CRM_alert_target</td>
      <td>Fencing target (fencing events)</td>
    </tr>
  </tbody>
</table>

<div class="language-bash highlighter-rouge"><div class="highlight"><pre class="highlight"><code><span class="c">#!/bin/bash</span>
<span class="c">#</span>
<span class="c"># alert_nsca.sh - Pacemaker alert agent</span>
<span class="c"># Submits passive check results to Nagios via NSCA-ng on cluster state changes</span>
<span class="c">#</span>

<span class="nv">NAGIOS_HOST</span><span class="o">=</span><span class="s2">"10.0.5.12"</span>
<span class="nv">NSCA_CFG</span><span class="o">=</span><span class="s2">"/etc/send_nsca.cfg"</span>
<span class="nv">SERVICE_DESC</span><span class="o">=</span><span class="s2">"Pacemaker Events"</span>

<span class="k">case</span> <span class="s2">"</span><span class="nv">$CRM_alert_kind</span><span class="s2">"</span> <span class="k">in
    </span>node<span class="p">)</span>
        <span class="k">case</span> <span class="s2">"</span><span class="nv">$CRM_alert_desc</span><span class="s2">"</span> <span class="k">in
            </span>member<span class="p">)</span>
                <span class="nv">STATUS</span><span class="o">=</span>0
                <span class="nv">MSG</span><span class="o">=</span><span class="s2">"Node </span><span class="nv">$CRM_alert_node</span><span class="s2"> is now online"</span>
                <span class="p">;;</span>
            lost<span class="p">)</span>
                <span class="nv">STATUS</span><span class="o">=</span>2
                <span class="nv">MSG</span><span class="o">=</span><span class="s2">"Node </span><span class="nv">$CRM_alert_node</span><span class="s2"> is now OFFLINE"</span>
                <span class="p">;;</span>
            <span class="k">*</span><span class="p">)</span>
                <span class="nv">STATUS</span><span class="o">=</span>1
                <span class="nv">MSG</span><span class="o">=</span><span class="s2">"Node </span><span class="nv">$CRM_alert_node</span><span class="s2"> state changed: </span><span class="nv">$CRM_alert_desc</span><span class="s2">"</span>
                <span class="p">;;</span>
        <span class="k">esac</span>
        <span class="nb">printf</span> <span class="s2">"%s	%s	%s	%s
"</span> <span class="se">\</span>
            <span class="s2">"</span><span class="nv">$CRM_alert_node</span><span class="s2">"</span> <span class="s2">"</span><span class="nv">$SERVICE_DESC</span><span class="s2">"</span> <span class="s2">"</span><span class="nv">$STATUS</span><span class="s2">"</span> <span class="s2">"</span><span class="nv">$MSG</span><span class="s2">"</span> | <span class="se">\</span>
            send_nsca <span class="nt">-H</span> <span class="s2">"</span><span class="nv">$NAGIOS_HOST</span><span class="s2">"</span> <span class="nt">-c</span> <span class="s2">"</span><span class="nv">$NSCA_CFG</span><span class="s2">"</span>
        <span class="p">;;</span>
    resource<span class="p">)</span>
        <span class="k">if</span> <span class="o">[</span> <span class="s2">"</span><span class="nv">$CRM_alert_rc</span><span class="s2">"</span> <span class="o">!=</span> <span class="s2">"0"</span> <span class="o">]</span><span class="p">;</span> <span class="k">then
            </span><span class="nv">STATUS</span><span class="o">=</span>2
            <span class="nv">MSG</span><span class="o">=</span><span class="s2">"FAILED: </span><span class="nv">$CRM_alert_rsc</span><span class="s2"> </span><span class="nv">$CRM_alert_task</span><span class="s2"> on </span><span class="nv">$CRM_alert_node</span><span class="s2"> (rc=</span><span class="nv">$CRM_alert_rc</span><span class="s2">)"</span>
        <span class="k">else
            </span><span class="nv">STATUS</span><span class="o">=</span>0
            <span class="nv">MSG</span><span class="o">=</span><span class="s2">"OK: </span><span class="nv">$CRM_alert_rsc</span><span class="s2"> </span><span class="nv">$CRM_alert_task</span><span class="s2"> on </span><span class="nv">$CRM_alert_node</span><span class="s2">"</span>
        <span class="k">fi
        </span><span class="nb">printf</span> <span class="s2">"%s	%s	%s	%s
"</span> <span class="se">\</span>
            <span class="s2">"</span><span class="nv">$CRM_alert_node</span><span class="s2">"</span> <span class="s2">"</span><span class="nv">$SERVICE_DESC</span><span class="s2">"</span> <span class="s2">"</span><span class="nv">$STATUS</span><span class="s2">"</span> <span class="s2">"</span><span class="nv">$MSG</span><span class="s2">"</span> | <span class="se">\</span>
            send_nsca <span class="nt">-H</span> <span class="s2">"</span><span class="nv">$NAGIOS_HOST</span><span class="s2">"</span> <span class="nt">-c</span> <span class="s2">"</span><span class="nv">$NSCA_CFG</span><span class="s2">"</span>
        <span class="p">;;</span>
    fencing<span class="p">)</span>
        <span class="nv">STATUS</span><span class="o">=</span>2
        <span class="nv">MSG</span><span class="o">=</span><span class="s2">"STONITH: </span><span class="nv">$CRM_alert_node</span><span class="s2"> fenced </span><span class="nv">$CRM_alert_target</span><span class="s2">"</span>
        <span class="nb">printf</span> <span class="s2">"%s	%s	%s	%s
"</span> <span class="se">\</span>
            <span class="s2">"</span><span class="nv">$CRM_alert_node</span><span class="s2">"</span> <span class="s2">"</span><span class="nv">$SERVICE_DESC</span><span class="s2">"</span> <span class="s2">"</span><span class="nv">$STATUS</span><span class="s2">"</span> <span class="s2">"</span><span class="nv">$MSG</span><span class="s2">"</span> | <span class="se">\</span>
            send_nsca <span class="nt">-H</span> <span class="s2">"</span><span class="nv">$NAGIOS_HOST</span><span class="s2">"</span> <span class="nt">-c</span> <span class="s2">"</span><span class="nv">$NSCA_CFG</span><span class="s2">"</span>
        <span class="p">;;</span>
<span class="k">esac</span>
</code></pre></div></div>

<h3 id="87-selinux-configuration">8.7 SELinux Configuration</h3>

<p>SELinux enforcement on RHEL 9 is aggressive around anything that crosses privilege or domain boundaries — and monitoring does exactly that: NRPE runs as the <code class="language-plaintext highlighter-rouge">nrpe</code> confined user, executes sudo to reach root-owned tools, which then communicate with cluster daemons via Unix sockets. Each crossing requires explicit permission.</p>

<p>The pattern is consistent across all monitoring checks: set the <code class="language-plaintext highlighter-rouge">nrpe_t</code> domain to permissive to allow execution while logging all denials, exercise the check, capture everything with <code class="language-plaintext highlighter-rouge">audit2allow</code>, build policy modules, return to enforcing.</p>

<p><strong>Booleans (both nodes):</strong></p>

<div class="language-bash highlighter-rouge"><div class="highlight"><pre class="highlight"><code>setsebool <span class="nt">-P</span> nagios_run_sudo 1
setsebool <span class="nt">-P</span> daemons_enable_cluster_mode 1
</code></pre></div></div>

<p><code class="language-plaintext highlighter-rouge">nagios_run_sudo</code> allows the NRPE process to execute sudo. <code class="language-plaintext highlighter-rouge">daemons_enable_cluster_mode</code> allows crm_mon to connect to the Pacemaker/Corosync socket.</p>

<p><strong>Policy modules — check_pacemaker (both nodes):</strong></p>

<div class="language-bash highlighter-rouge"><div class="highlight"><pre class="highlight"><code>semanage permissive <span class="nt">-a</span> nrpe_t
/usr/lib64/nagios/plugins/check_nrpe <span class="nt">-H</span> localhost <span class="nt">-c</span> check_pacemaker
ausearch <span class="nt">-c</span> <span class="s1">'sudo'</span> <span class="nt">--raw</span> | audit2allow <span class="nt">-M</span> nagios-sudo
semodule <span class="nt">-X</span> 300 <span class="nt">-i</span> nagios-sudo.pp
ausearch <span class="nt">-c</span> <span class="s1">'crm_mon'</span> <span class="nt">--raw</span> | audit2allow <span class="nt">-M</span> nagios-crm
semodule <span class="nt">-X</span> 300 <span class="nt">-i</span> nagios-crm.pp
semanage permissive <span class="nt">-d</span> nrpe_t
</code></pre></div></div>

<p><strong>Policy modules — check_multipath (both nodes):</strong></p>

<div class="language-bash highlighter-rouge"><div class="highlight"><pre class="highlight"><code>semanage permissive <span class="nt">-a</span> nrpe_t
/usr/lib64/nagios/plugins/check_multipath
ausearch <span class="nt">-c</span> <span class="s1">'check_multipath'</span> <span class="nt">--raw</span> | audit2allow <span class="nt">-M</span> nagios-multipath
semodule <span class="nt">-X</span> 300 <span class="nt">-i</span> nagios-multipath.pp
ausearch <span class="nt">-c</span> <span class="s1">'multipathd'</span> <span class="nt">--raw</span> | audit2allow <span class="nt">-M</span> nagios-multipathd
semodule <span class="nt">-X</span> 300 <span class="nt">-i</span> nagios-multipathd.pp
ausearch <span class="nt">-c</span> <span class="s1">'grep'</span> <span class="nt">--raw</span> | audit2allow <span class="nt">-M</span> nagios-grep
semodule <span class="nt">-X</span> 300 <span class="nt">-i</span> nagios-grep.pp
semanage permissive <span class="nt">-d</span> nrpe_t
</code></pre></div></div>

<p>The <code class="language-plaintext highlighter-rouge">grep execmem</code> denial warrants a note — SELinux flags this as potentially serious since executable memory access by grep is unusual. In this context it is benign: grep running in the confined <code class="language-plaintext highlighter-rouge">nrpe_t</code> domain triggers a policy gap rather than indicating a real security issue. Reviewed and accepted.</p>

<p><strong>Policy modules on rhel2</strong> can be copied directly from rhel1 rather than rebuilt:</p>

<div class="language-bash highlighter-rouge"><div class="highlight"><pre class="highlight"><code>scp root@10.0.5.21:/root/nagios-<span class="k">*</span>.pp /root/
semodule <span class="nt">-X</span> 300 <span class="nt">-i</span> nagios-sudo.pp nagios-crm.pp nagios-multipath.pp <span class="se">\</span>
    nagios-multipathd.pp nagios-grep.pp
</code></pre></div></div>

<p>For shared storage contexts see section 6.9.</p>

<h3 id="88-validation">8.8 Validation</h3>

<p><strong>Active polling — PostgreSQL kill -9:</strong></p>

<div class="language-bash highlighter-rouge"><div class="highlight"><pre class="highlight"><code><span class="nb">kill</span> <span class="nt">-9</span> <span class="si">$(</span>pgrep <span class="nt">-f</span> <span class="s2">"postgres -D"</span><span class="si">)</span>
</code></pre></div></div>

<p>Both cluster nodes immediately showed WARNING on <code class="language-plaintext highlighter-rouge">Pacemaker Status</code> —
fail-count detected on pg-db before Pacemaker restarted it. Resolved to OK
within the next poll cycle after <code class="language-plaintext highlighter-rouge">pcs resource cleanup pg-db</code>.</p>

<p><strong>Event-driven alerting — node offline/STONITH/rejoin sequence:</strong></p>

<p>The following sequence was captured in the nsca-ng log on the Nagios host
during a hard power-off of rhel2 from the Proxmox UI:</p>

<div class="language-plaintext highlighter-rouge"><div class="highlight"><pre class="highlight"><code>20:04:52  rhel2;Pacemaker Events;2;Node rhel2 is now OFFLINE
20:05:25  rhel2;Pacemaker Events;2;STONITH: rhel2 fenced
20:05:59  rhel2;Pacemaker Events;0;Node rhel2 is now online
</code></pre></div></div>

<p>All three events reported from rhel1 — rhel2 was the subject of the events,
rhel1 was the surviving node reporting them. Nagios correctly attributed each
result to rhel2’s <code class="language-plaintext highlighter-rouge">Pacemaker Events</code> service. The Nagios UI showed rhel2 go
CRITICAL at 20:04:52 and return to OK at 20:05:59 — a 67 second window fully
captured without polling.</p>

<p>The STONITH event record in particular is significant. It remains in Nagios
history after the node recovers, providing an audit trail: a fencing action
occurred, at this timestamp, against this node. That record is what triggers
the postmortem.</p>

<hr />

<h3 id="89-multipath-failure-validation">8.9 Multipath Failure Validation</h3>

<p>This section validates the complete failure detection and recovery chain for
total storage path loss — a failure mode that exposed significant gaps in the
initial configuration and required deliberate work to solve correctly.</p>

<h4 id="the-problem-monitoring-that-cannot-see-the-failure">The Problem: Monitoring That Cannot See the Failure</h4>

<p>With <code class="language-plaintext highlighter-rouge">no_path_retry queue</code> in the initial configuration, total loss of all
storage paths caused I/O to queue indefinitely in the kernel. PostgreSQL hung
waiting for I/O that would never complete. From every monitoring perspective
the system appeared healthy:</p>

<ul>
  <li>Pacemaker: pg-db process running, filesystem mounted, VIP assigned — all monitors passing</li>
  <li>Nagios PostgreSQL check: accepting connections, returning results (lightweight queries not touching storage)</li>
  <li>Cluster heartbeat: both nodes online, quorum maintained</li>
</ul>

<p>The service was completely non-functional. Nothing detected it.</p>

<p>This is the failure mode the introduction describes — not the server dying
outright, but the service off in the weeds. And it is precisely the failure
mode that naive HA configuration, naive monitoring, and naive multipath
configuration conspire to hide.</p>

<h4 id="the-fix-three-layers-working-together">The Fix: Three Layers Working Together</h4>

<p><strong>Layer 1 — multipath.conf:</strong></p>

<p><code class="language-plaintext highlighter-rouge">no_path_retry queue</code> is a common recommendation for standalone servers — it protects the OS from I/O errors by queuing until a path recovers, which is the right behavior when there is no higher-level mechanism to detect and respond to storage loss. In a cluster environment the calculus reverses: you specifically want I/O to fail so that Pacemaker receives the error signal needed to trigger resource failover. Red Hat’s own default for <code class="language-plaintext highlighter-rouge">no_path_retry</code> is actually <code class="language-plaintext highlighter-rouge">fail</code>, not <code class="language-plaintext highlighter-rouge">queue</code> — which means <code class="language-plaintext highlighter-rouge">queue</code> was never the right choice here, even if it is commonly seen in iSCSI examples.</p>

<p>Getting <code class="language-plaintext highlighter-rouge">fail</code> to actually take effect was not straightforward. Device-specific stanzas in the built-in multipath configuration matched TrueNAS’s generic iSCSI identification and silently overrode the defaults section. Additionally, a numeric <code class="language-plaintext highlighter-rouge">no_path_retry</code> value causes multipathd to inject <code class="language-plaintext highlighter-rouge">queue_if_no_path</code> into the kernel dm table automatically, regardless of what the config file says — so even intermediate attempts with <code class="language-plaintext highlighter-rouge">no_path_retry 3</code> were not working as expected.</p>

<p>The <code class="language-plaintext highlighter-rouge">overrides</code> section beats device stanzas and applying <code class="language-plaintext highlighter-rouge">no_path_retry "fail"</code> there with <code class="language-plaintext highlighter-rouge">features "0"</code> to prevent the queue flag from being re-injected produced the correct result:</p>

<div class="language-plaintext highlighter-rouge"><div class="highlight"><pre class="highlight"><code>overrides {
    no_path_retry "fail"
    features "0"
}
</code></pre></div></div>

<p>This configuration warrants revisiting if the storage environment changes — on a standalone server, <code class="language-plaintext highlighter-rouge">fail</code> means applications receive I/O errors immediately on total path loss rather than waiting for recovery, which may not be desirable.</p>

<p><strong>Layer 2 — Pacemaker OCF_CHECK_LEVEL=10:</strong></p>

<p>With <code class="language-plaintext highlighter-rouge">no_path_retry "fail"</code> in place, total path loss returns EIO immediately
rather than queuing. The LVM-activate resource agent’s <code class="language-plaintext highlighter-rouge">OCF_CHECK_LEVEL=10</code>
monitor performs a raw read of the underlying block device. When that read
returns EIO, Pacemaker receives a clean failure signal and can act.</p>

<div class="language-bash highlighter-rouge"><div class="highlight"><pre class="highlight"><code>pcs resource update pg-lvm <span class="se">\</span>
    op monitor <span class="nv">interval</span><span class="o">=</span>30s <span class="nv">OCF_CHECK_LEVEL</span><span class="o">=</span>10 <span class="nb">timeout</span><span class="o">=</span>30s
</code></pre></div></div>

<p><strong>Layer 3 — Nagios multipath monitoring:</strong></p>

<p>The <code class="language-plaintext highlighter-rouge">check_multipath</code> script monitors path health independently of Pacemaker,
providing early warning on single-path degradation before total loss occurs.</p>

<h4 id="validation--total-storage-path-loss">Validation — Total Storage Path Loss</h4>

<p>Resources running on rhel2. Write loop running from rhel1 via floating VIP.
Both physical storage cables pulled from rhel2 simultaneously.</p>

<p><strong>Write loop output:</strong></p>

<div class="language-plaintext highlighter-rouge"><div class="highlight"><pre class="highlight"><code>05:13:27  INSERT 0 1   ← last successful write before paths lost
05:13:44  PANIC: could not fdatasync file "...": Input/output error
          server closed the connection unexpectedly
05:13:45  Connection refused  ─┐
05:13:46  Connection refused   │  pg-db crashed, Pacemaker detecting
05:13:47  Connection refused   │  failure, STONITH firing against rhel2
          ...                  │
05:14:23  No route to host  ───┘  rhel2 fenced, VIP gone
05:14:27  No route to host
          ...
05:14:41  INSERT 0 1   ← resources up on rhel1, writes resume
</code></pre></div></div>

<p><strong>Total disruption: ~74 seconds.</strong></p>

<p>The transition from <code class="language-plaintext highlighter-rouge">Connection refused</code> to <code class="language-plaintext highlighter-rouge">No route to host</code> marks the
STONITH moment — rhel2’s network interface disappears when the VM is fenced
via the Proxmox API.</p>

<p><strong>Sequence of events:</strong></p>

<ol>
  <li>Both storage paths lost — <code class="language-plaintext highlighter-rouge">no_path_retry "fail"</code> returns EIO immediately</li>
  <li>PostgreSQL panics on fdatasync failure — process crashes cleanly</li>
  <li>Pacemaker pg-db monitor detects process gone — declares resource failed</li>
  <li>OCF_CHECK_LEVEL=10 LVM monitor detects storage failure independently</li>
  <li>STONITH fires against rhel2 via pve2 API</li>
  <li>Resources migrate to rhel1 — LVM activates, filesystem mounts, PostgreSQL starts</li>
  <li>VIP moves to rhel1 — client connections resume</li>
</ol>

<p><strong>Data integrity confirmed:</strong></p>

<div class="language-sql highlighter-rouge"><div class="highlight"><pre class="highlight"><code><span class="k">SELECT</span> <span class="k">count</span><span class="p">(</span><span class="o">*</span><span class="p">)</span> <span class="k">FROM</span> <span class="n">failover_test</span><span class="p">;</span>
</code></pre></div></div>

<p>All rows present. No data loss despite a storage-level I/O panic on the active node.</p>

<p><strong>Nagios multipath monitoring during single-path degradation (separate test):</strong></p>

<p>With one cable pulled, the <code class="language-plaintext highlighter-rouge">Multipath</code> service on rhel2 went WARNING in Nagios
within the next poll interval:</p>

<div class="language-plaintext highlighter-rouge"><div class="highlight"><pre class="highlight"><code>WARNING: mpatha degraded (1/2 paths ready) — failed: sdb
</code></pre></div></div>

<p>Write loop showed zero disruption — multipath transparently rerouted all I/O
through the remaining path. This is the correct behavior: single-path loss is
absorbed silently at the storage layer, surfaced as a warning in monitoring,
and requires no cluster-level action. It is a signal that redundancy has
degraded and attention is needed before the situation worsens — not a failover
trigger.</p>

<h3 id="screenshots">Screenshots</h3>
<p><img src="/assets/img/enterprise-linux-ha-cluster-build-V1.png" alt="shell screenshot" />
—
<img src="/assets/img/enterprise-linux-ha-cluster-build-V2.png" alt="shell screenshot" />
—
<img src="/assets/img/enterprise-linux-ha-cluster-build-V3.png" alt="shell screenshot" />
—
<img src="/assets/img/enterprise-linux-ha-cluster-build-V4.png" alt="shell screenshot" />
—
<img src="/assets/img/enterprise-linux-ha-cluster-build-V5.png" alt="shell screenshot" />
—</p>

<h2 id="logging">Logging</h2>

<h3 id="log-sources">Log Sources</h3>

<table>
  <thead>
    <tr>
      <th>Source</th>
      <th>Location</th>
      <th>What it covers</th>
    </tr>
  </thead>
  <tbody>
    <tr>
      <td>Pacemaker</td>
      <td><code class="language-plaintext highlighter-rouge">/var/log/pacemaker/pacemaker.log</code></td>
      <td>All cluster decisions, resource transitions, fencing events</td>
    </tr>
    <tr>
      <td>Corosync</td>
      <td><code class="language-plaintext highlighter-rouge">/var/log/cluster/corosync.log</code></td>
      <td>Node membership, quorum changes</td>
    </tr>
    <tr>
      <td>systemd</td>
      <td><code class="language-plaintext highlighter-rouge">journalctl -u pacemaker</code></td>
      <td>Useful for startup/shutdown; less detail than pacemaker.log</td>
    </tr>
    <tr>
      <td>PostgreSQL</td>
      <td><code class="language-plaintext highlighter-rouge">/mnt/cluster1/pgsql/data/log/</code></td>
      <td>Application-level errors — I/O panics will appear here before Pacemaker acts</td>
    </tr>
  </tbody>
</table>

<p>The primary log for cluster troubleshooting is <code class="language-plaintext highlighter-rouge">pacemaker.log</code>. It contains timestamped entries from every Pacemaker subsystem — the CIB, the scheduler, the executor, the fencer — and shows the full decision chain during a failover. Corosync’s log is narrower and more useful for isolating membership and split-brain events specifically. The PostgreSQL logs on shared storage are worth knowing about because a storage failure will surface there first, before Pacemaker’s monitor fires.</p>

<h3 id="useful-commands">Useful Commands</h3>

<div class="language-bash highlighter-rouge"><div class="highlight"><pre class="highlight"><code><span class="c"># Watch cluster status live</span>
crm_mon <span class="nt">-f</span> <span class="nt">-r</span>

<span class="c"># Follow pacemaker log in real time</span>
<span class="nb">tail</span> <span class="nt">-f</span> /var/log/pacemaker/pacemaker.log

<span class="c"># Filter for a specific resource</span>
<span class="nb">grep </span>pg-db /var/log/pacemaker/pacemaker.log

<span class="c"># Filter for fencing events specifically</span>
<span class="nb">grep</span> <span class="nt">-i</span> <span class="nt">-e</span> fence <span class="nt">-e</span> stonith /var/log/pacemaker/pacemaker.log

<span class="c"># Show recent cluster transitions</span>
<span class="nb">grep </span>Transition /var/log/pacemaker/pacemaker.log

<span class="c"># Enable debug logging for a specific subsystem (not persistent)</span>
<span class="c"># Edit /etc/sysconfig/pacemaker:</span>
<span class="c"># PCMK_debug="pacemaker-execd"</span>
<span class="c"># then: systemctl restart pacemaker</span>
</code></pre></div></div>

<h3 id="operational-notes">Operational Notes</h3>

<p>Pacemaker’s log is verbose during normal operation — heartbeats, monitor results, CIB updates all produce entries. The signal-to-noise ratio improves once you know what normal looks like. Spend time reading the log during non-incident periods so that during an actual failure the pattern of a clean failover versus something going wrong is immediately recognizable.</p>

<p>The PCMK_debug variable in <code class="language-plaintext highlighter-rouge">/etc/sysconfig/pacemaker</code> enables subsystem-level debug logging. It was used during this build to diagnose the alert agent not firing (enabling <code class="language-plaintext highlighter-rouge">pacemaker-execd</code> revealed the invocation details). It requires a Pacemaker restart and is not intended for persistent production use.</p>

<hr />

<h2 id="operational-reference">Operational Reference</h2>

<h3 id="cluster-status">Cluster Status</h3>

<p>The go-to command. Run it from either node — both have a consistent view.</p>

<div class="language-plaintext highlighter-rouge"><div class="highlight"><pre class="highlight"><code>[root@rhel1 /]# pcs status
Cluster name: mycluster
Cluster Summary:
  * Stack: corosync (Pacemaker is running)
  * Current DC: rhel1 (version 2.1.10-1.1.el9_7-5693eaeee) - partition with quorum
  * Last updated: Mon Apr 13 07:32:19 2026 on rhel1
  * Last change:  Sun Apr 12 05:07:39 2026 by root via root on rhel1
  * 2 nodes configured
  * 6 resource instances configured

Node List:
  * Online: [ rhel1 rhel2 ]

Full List of Resources:
  * fence-rhel1 (stonith:fence_pve):     Started rhel2
  * fence-rhel2 (stonith:fence_pve):     Started rhel1
  * pg-lvm      (ocf:heartbeat:LVM-activate):    Started rhel1
  * pg-fs       (ocf:heartbeat:Filesystem):      Started rhel1
  * pg-vip      (ocf:heartbeat:IPaddr2):         Started rhel1
  * pg-db       (ocf:heartbeat:pgsql):   Started rhel1

Daemon Status:
  corosync: active/enabled
  pacemaker: active/enabled
  pcsd: active/enabled
</code></pre></div></div>

<p>Things to look at: all nodes Online, all resources Started, Daemon Status all active/enabled, “partition with quorum” in the summary. Any deviation from this is worth understanding.</p>

<p><code class="language-plaintext highlighter-rouge">crm_mon -1 -r -f</code> gives a similar view with slightly more detail including migration history and fail-counts.</p>

<h3 id="moving-resources--standby-and-unstandby">Moving Resources — Standby and Unstandby</h3>

<p>Putting a node into standby is the clean way to move resources off it for maintenance. Pacemaker gracefully migrates everything to the other node.</p>

<div class="language-plaintext highlighter-rouge"><div class="highlight"><pre class="highlight"><code>[root@rhel2 ~]# pcs node standby rhel1
</code></pre></div></div>

<p>Resources migrate within seconds. The standby node stays in the cluster and participates in quorum — it just won’t run resources.</p>

<div class="language-plaintext highlighter-rouge"><div class="highlight"><pre class="highlight"><code>Node List:
  * Node rhel1: standby
  * Online: [ rhel2 ]

Full List of Resources:
  * fence-rhel1 (stonith:fence_pve):     Started rhel2
  * fence-rhel2 (stonith:fence_pve):     Stopped
  * pg-lvm      (ocf:heartbeat:LVM-activate):    Started rhel2
  * pg-fs       (ocf:heartbeat:Filesystem):      Started rhel2
  * pg-vip      (ocf:heartbeat:IPaddr2):         Started rhel2
  * pg-db       (ocf:heartbeat:pgsql):   Started rhel2
</code></pre></div></div>

<p>Return the node to service:</p>

<div class="language-plaintext highlighter-rouge"><div class="highlight"><pre class="highlight"><code>[root@rhel2 ~]# pcs node unstandby rhel1
</code></pre></div></div>

<p>Resources do not automatically migrate back — they stay on rhel2 until the next natural failover or manual move. rhel1 resumes its role as a live standby.</p>

<h3 id="maintenance-mode">Maintenance Mode</h3>

<p>Maintenance mode tells Pacemaker to stop managing resources entirely — no monitoring, no restarts, no failovers. Use it when you need to work on something without the cluster fighting you: stabilizing a resource that keeps failing, making configuration changes, or any situation where automated recovery would make things worse.</p>

<div class="language-plaintext highlighter-rouge"><div class="highlight"><pre class="highlight"><code>[root@rhel2 ~]# pcs property set maintenance-mode=true
</code></pre></div></div>

<p>Status shows the cluster has stepped back:</p>

<div class="language-plaintext highlighter-rouge"><div class="highlight"><pre class="highlight"><code>              *** Resource management is DISABLED ***
  The cluster will not attempt to start, stop or recover services

Full List of Resources:
  * fence-rhel1 (stonith:fence_pve):     Started rhel2 (maintenance)
  * fence-rhel2 (stonith:fence_pve):     Started rhel1 (maintenance)
  * pg-lvm      (ocf:heartbeat:LVM-activate):    Started rhel2 (maintenance)
  * pg-fs       (ocf:heartbeat:Filesystem):      Started rhel2 (maintenance)
  * pg-vip      (ocf:heartbeat:IPaddr2):         Started rhel2 (maintenance)
  * pg-db       (ocf:heartbeat:pgsql):   Started rhel2 (maintenance)
</code></pre></div></div>

<p>Check that it’s set before assuming:</p>

<div class="language-plaintext highlighter-rouge"><div class="highlight"><pre class="highlight"><code>[root@rhel2 ~]# pcs property config | grep maintenance-mode
  maintenance-mode=true
</code></pre></div></div>

<p>Return to normal:</p>

<div class="language-plaintext highlighter-rouge"><div class="highlight"><pre class="highlight"><code>[root@rhel2 ~]# pcs property set maintenance-mode=false
</code></pre></div></div>

<p>Monitors resume immediately. Don’t forget to turn it off.</p>

<h3 id="clearing-failed-resources">Clearing Failed Resources</h3>

<p>After a resource failure that has been resolved, Pacemaker retains the failure record. The resource may be running again but the cluster still shows a fail-count. Clear it:</p>

<div class="language-bash highlighter-rouge"><div class="highlight"><pre class="highlight"><code>pcs resource cleanup pg-db
</code></pre></div></div>

<p>Or clear all resources at once:</p>

<div class="language-bash highlighter-rouge"><div class="highlight"><pre class="highlight"><code>pcs resource cleanup
</code></pre></div></div>

<p>This resets fail-counts and clears any failed action history. Run <code class="language-plaintext highlighter-rouge">pcs status</code> after to confirm everything looks clean.</p>

<hr />

<h2 id="key-design-decisions-and-rationale">Key Design Decisions and Rationale</h2>

<ul>
  <li>Brainstorm likely failure scenarios early, then test them aggressively. Pay special attention to partial/gray failures (server off in the weeds, lost backend connectivity, etc.), not just clean “node died” cases.</li>
  <li>Incorporate solid alerting. If failover works, you won’t see customer impact — but you still need to know it happened.</li>
  <li>Favor general, composable mechanisms (even if partly manual) that emphasize survivability and operability under pressure. They don’t need to predict every failure — only supply the building blocks and flexibility to adapt when reality inevitably deviates.</li>
  <li>Keep complexity under control. In HA systems, unnecessary complexity becomes a failure mode of its own.</li>
  <li>“Edge case, we’re working on it” is acceptable — for a while. HA maturity is iterative.</li>
</ul>

<hr />

<h2 id="implementation-footnotes">Implementation Footnotes</h2>

<h3 id="known-limitations--accepted-risk">Known Limitations &amp; Accepted Risk</h3>

<p><strong>Fencing topology</strong> — Each fence resource targets the hypervisor hosting the VM. If that hypervisor fails, fencing fails and automatic failover stalls. Cross-host fencing via the Proxmox cluster API was tested and did not work. iDRAC was rejected as a fallback due to unacceptable blast radius (fences entire physical host). Accepted limitation.</p>

<hr />

<h3 id="explored-and-rejected">Explored and Rejected</h3>

<p><strong>PostgreSQL functional health check</strong> — The pgsql resource agent supports monitor credentials that run an actual query on each interval rather than checking process existence. Implemented and exercised. The functional check proved more sensitive to transitional state than PostgreSQL itself — failing on conditions that were expected and temporary, risking recovery actions against a database that was functioning correctly or about to be. Backed out.</p>

<hr />

<h3 id="platform-realities">Platform Realities</h3>

<p><strong>SELinux</strong> — Significant SELinux work was required across both the cluster resource stack and the monitoring layer. Shared storage contexts are covered in section 6.9; monitoring policy modules and booleans in section 8.7. The common thread: RHEL 9 SELinux is aggressive at privilege and domain boundaries, manual invocations as root mask problems that only surface when agents run in confined contexts.</p>

<p><strong>no_path_retry</strong> — <code class="language-plaintext highlighter-rouge">queue</code> is commonly recommended for standalone servers but is the wrong choice in a cluster — you need I/O to fail so Pacemaker can detect storage loss and act. Red Hat’s own default is <code class="language-plaintext highlighter-rouge">fail</code>. Getting <code class="language-plaintext highlighter-rouge">fail</code> to actually apply required an <code class="language-plaintext highlighter-rouge">overrides</code> section (which beats device-specific stanzas) combined with <code class="language-plaintext highlighter-rouge">features "0"</code> to prevent multipathd from silently re-injecting <code class="language-plaintext highlighter-rouge">queue_if_no_path</code> into the kernel dm table when a numeric retry count is used. If the storage environment changes, this choice warrants revisiting.</p>]]></content><author><name></name></author><summary type="html"><![CDATA[Introduction Most of the attention in modern infrastructure goes to cloud-native, horizontally-scalable systems. But a large share of the software that keeps real businesses running can’t work that way — whether due to data consistency constraints, licensing, or simply because the application was built assuming it’s the only instance. For those workloads, the redundancy model is active/standby: one live instance, one warm spare. That’s the class of problem this guide addresses. What follows is a complete, end-to-end implementation walkthrough: iSCSI multipath — shared storage accessible from multiple hosts LVM with exclusive activation — ensuring only one host mounts the volume at a time Pacemaker/Corosync — the cluster manager that orchestrates failover PostgreSQL + a floating VIP — the workload being protected, reachable at a stable address The configuration is validated against four distinct failure scenarios.]]></summary></entry><entry><title type="html">Custom Monitoring with Net-SNMP and SolarWinds Universal Device Pollers</title><link href="http://localhost:4000/2025/01/13/custom-monitoring.html" rel="alternate" type="text/html" title="Custom Monitoring with Net-SNMP and SolarWinds Universal Device Pollers" /><published>2025-01-13T03:00:00-05:00</published><updated>2025-01-13T03:00:00-05:00</updated><id>http://localhost:4000/2025/01/13/custom-monitoring</id><content type="html" xml:base="http://localhost:4000/2025/01/13/custom-monitoring.html"><![CDATA[<h2 id="background">Background</h2>

<p>Early in my career, I was on the front lines in a new war against spam email. The problem was challenging and largely unsolved. Few players were in the market, and success was measured by simply having any solution, even if it wasn’t stable or fully polished. Customers tolerated “war stories” of failures because the focus was on solving the problem at all.</p>

<p>Over time, as the spam problem became more solvable, the industry matured, and expectations rose. A shake-out occurred, where companies that couldn’t execute well were left behind. Larger players (e.g., big tech) consolidated the leaders, bundling spam filtering as part of broader offerings. This commoditization negatively impacted smaller, independent players.</p>

<p>While consolidation can be bad news for mid-sized companies, it also creates opportunities. Big tech tends to bundle “good enough” solutions, leaving space for smaller companies to compete with niche, best-in-class offerings that target customers seeking premium solutions.</p>

<h2 id="overview">Overview</h2>
<p>As it turns out, best in class is about more than feature set. Features need to be backed up by solid execution. Big tech sets a high bar; they have tons of resources to dedicate to site reliability.</p>

<h3 id="key-risks">Key Risks</h3>
<ul>
  <li><strong>Customer-Discovered Outages</strong>: Being unaware of your own outage and failing to promptly spin up on it is a problem. When you self-discover an outage early, you have a chance to engage with it so that your customer doesn’t have to. If your customer is forced to call your hotline, it’s hard to avoid the perception that you’re asleep at the switch.</li>
  <li><strong>Timeline Analysis</strong>: Once the customer reports the issue, the first thing they will demand is “when did this start?” You will have to go back through your logs and detail records to isolate the start of the incident, and it’s this incident start time—not the time that you became aware of the issue—that will form the basis of the Incident Timeline included in the post-outage write-up.</li>
  <li><strong>Executive Visibility</strong>: Outages reach the highest levels of scrutiny within an organization. Root Cause Analysis (RCA) and Reason For Outage (RFO) write-ups are reviewed by top leadership, both within your company and at the customer side. Seemingly little things like allowing a few hours to slip between customer updates—even if you are working the issue diligently—become big questions in an escalated incident review, providing ammunition for a narrative to be crafted against you and impacting the perceived handling of the incident.</li>
  <li><strong>SLA Impact</strong>: Service Level Agreements (SLAs) often include penalty clauses for downtime. Delayed detection means logging significant downtime, which can lead to financial penalties with no chance for recovery.</li>
  <li><strong>Customer Churn and Reputational Damage</strong>: Inadequate monitoring leading to undetected outages can severely damage your organization’s reputation. Customers lose trust and confidence when they feel their service provider is unstable. This erosion of trust can impact referenceability and result in increased customer churn.</li>
</ul>

<h3 id="aspects-of-a-successful-monitoring-operation">Aspects of a Successful Monitoring Operation</h3>
<ol>
  <li><strong>Aim for Excellence</strong>: Monitoring is like any other aspect of a product launch—it involves detailed work to discover requirements, build solutions, and validate their effectiveness. To achieve excellence, monitoring must be embedded in the project, not treated as an afterthought. This requires participating in project teams on equal footing, ensuring monitoring is planned and implemented collaboratively with input from all stakeholders.</li>
  <li><strong>Technical Acumen</strong>: Monitoring requires a wide array of insights and skills, spanning collaboration, problem-solving, and strategic thinking. However, at its core, it demands deep technical expertise. The metrics being asked for aren’t easy to reach, and there’s no pre-canned integration to them—otherwise, they would have been collected already.</li>
  <li><strong>Stack Deep Dive</strong>: Total failures are relatively easy to catch, but silent failures—subtle issues that don’t cause outright crashes—can be just as damaging. These problems often degrade performance gradually, creating a complex mess once discovered. Consider scenarios like one system in a cluster running an outdated configuration or calls silently taking a PSTN failover path for weeks, resulting in unexpected costs. These issues often hide in the details—replicated configurations, middleware communications, or subtle misconfigurations.</li>
  <li><strong>Continuous Improvement</strong>: Conducting postmortems after every incident to discuss what worked, what didn’t, and where there’s room for improvement is essential. Beyond these formal reviews, always stay vigilant for conversations and clues where enhanced monitoring could make a difference. Be the monitoring and alerting champion, proactively offering improvements even when others might not see the opportunity.</li>
  <li><strong>Follow Through</strong>: Improvements are often identified during customer escalations and promised as part of resolving support engagements. However, once an engagement is closed, the customer may let the issue drop, leading to less accountability for delivering on the promise. To prevent this, it’s vital to demonstrate end-to-end ownership and ensure all commitments are met.</li>
  <li><strong>Art Not Science / Balancing Act</strong>: Creating monitoring alerts involves a delicate balance. You’re writing code that could wake someone up in the middle of the night, so it’s not always about adding more alerts—it’s about refining and sometimes subtracting. Always seek feedback to distinguish what is useful from what is noise. Sometimes, criteria like an unusual absence of volume might be necessary to catch issues, but you need to adjust for false positives. Some alerts are crucial but don’t require 24/7 paging. Remember, your first responders are your closest business partners; respect their work-life balance and ensure critical alerts aren’t lost in a flood of unnecessary ones.</li>
</ol>

<h2 id="simple-network-management-protocol">Simple Network Management Protocol</h2>

<p>SNMP, a protocol developed for managing devices, originated in the late 1980s through a collaborative effort involving multiple institutions.</p>

<p>SNMP supports both pull (GET) and push (TRAP) modes of signaling, making it highly versatile for a wide range of monitoring needs. Major hardware vendors have standardized around SNMP, effectively compelling its adoption for monitoring network equipment. While network vendors often provide their own proprietary solutions, these are typically closed systems, and SNMP remains the common denominator for interoperability. Due to this widespread standardization, SNMP has become a must-implement protocol in traditional IT environments, offering the unique ability to monitor every part of a network infrastructure. Despite the robust competition from platform-specific agents designed for Windows and Linux servers, SNMP’s universal applicability ensures its continued relevance as the single least common denominator in network monitoring.</p>

<h2 id="introduction-to-net-snmp-and-snmpd">Introduction to Net-SNMP and snmpd</h2>

<p>Net-SNMP is the most prominent implementation of SNMP agents and tools for UNIX and Linux environments. Its roots trace back to the CMU SNMP project, developed at Carnegie Mellon University. Building on this foundation, significant development occurred at UC Davis, where the project transitioned into what we now know as Net-SNMP. Wes Hardaker played a pivotal role during this phase, overseeing substantial refinements and expansions that transformed it into a robust suite, including the widely used <code class="language-plaintext highlighter-rouge">snmpd</code> agent. By the early 2000s, Net-SNMP had firmly established itself as a leading implementation, synonymous with SNMP on Linux systems.</p>

<p>
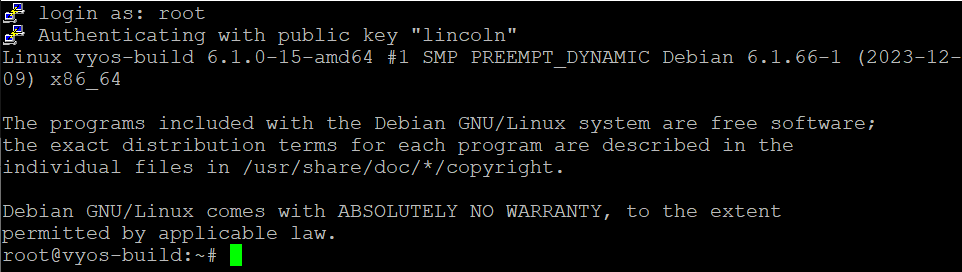
Net-SNMP is available for all major Linux distributions. I already chose Debian for the SBCs because FreeSWITCH prefers this distribution. I’ll install Net-SNMP on the Debian-based SBCs alongside FreeSWITCH for custom monitoring.</p>

<h3 id="enable-additional-repositories-optional">Enable additional repositories (optional)</h3>

<p>The <code class="language-plaintext highlighter-rouge">snmp-mibs-downloader</code> package is part of the non-free repository because it downloads non-open source Management Information Base (MIB) files. Net-SNMP itself is free, and while we may or may not use the MIBs in our exercise, it’s beneficial to install the MIBs together with the user tools. MIBs are a useful aid to SNMP software, but there is no hard requirement to use them.</p>

<div class="language-bash highlighter-rouge"><div class="highlight"><pre class="highlight"><code><span class="c"># Configure the contrib and non-free repos</span>
<span class="nb">sed</span> <span class="nt">-i</span> <span class="s1">'s/main/main contrib non-free/'</span> /etc/apt/sources.list
<span class="c"># Update the package list</span>
apt-get update
</code></pre></div></div>

<p>Install the software</p>

<div class="language-bash highlighter-rouge"><div class="highlight"><pre class="highlight"><code>apt <span class="nb">install </span>snmpd snmp smitools snmp-mibs-downloader
</code></pre></div></div>

<h3 id="configuring-snmp-agent-for-non-localhost-connections">Configuring SNMP Agent for Non-Localhost Connections</h3>

<p>It’s typical for server software to ship with a default localhost-only configuration as a safety measure to ensure the services are only externally reachable once you intend them to be.</p>

<p>To expose the SNMP agent (daemon) to non-localhost connections, you need to edit the <code class="language-plaintext highlighter-rouge">/etc/snmp/snmpd.conf</code> configuration file. Adjust the <code class="language-plaintext highlighter-rouge">agentaddress</code> line to specify the desired IP addresses.</p>

<p><strong>Considerations:</strong></p>
<ol>
  <li><strong>Binding to All Interfaces</strong>:
    <ul>
      <li>To bind the SNMP agent to all interfaces, specify <code class="language-plaintext highlighter-rouge">0.0.0.0</code> as the IP address. This is the most common configuration.</li>
    </ul>

    <div class="language-plaintext highlighter-rouge"><div class="highlight"><pre class="highlight"><code>agentaddress 0.0.0.0
</code></pre></div>    </div>
  </li>
  <li><strong>Binding to a Specific IP Address</strong>:
    <ul>
      <li>If you prefer to bind to a specific IP address, you can do so. However, note that if the system’s IP address changes (e.g., via DHCP or manual re-IP), the SNMP agent will fail to start.</li>
      <li>It’s recommended to keep <code class="language-plaintext highlighter-rouge">127.0.0.1</code> in the list to allow localhost connections.</li>
    </ul>

    <div class="language-plaintext highlighter-rouge"><div class="highlight"><pre class="highlight"><code>agentaddress 127.0.0.1,192.168.252.221
</code></pre></div>    </div>
  </li>
  <li><strong>Security Considerations</strong>:
    <ul>
      <li>On multi-homed systems connected to SIP Trunk networks, ensure that SNMP and SSH are not exposed to business partners. These protocols are intended for internal management only.</li>
    </ul>
  </li>
</ol>

<h3 id="configuring-snmp-community-strings-and-access">Configuring SNMP Community Strings and Access</h3>

<p>To avoid frustrations during your project work, it’s crucial to address authentication and permissions from the beginning. While you can get basic SNMP queries working out of the box, more advanced tasks require proper access configuration.</p>

<p><strong>Default Configuration</strong>:
The default SNMP configuration restricts the <code class="language-plaintext highlighter-rouge">public</code> community string to a <code class="language-plaintext highlighter-rouge">systemonly</code> view:</p>

<div class="language-plaintext highlighter-rouge"><div class="highlight"><pre class="highlight"><code>view   systemonly  included   .1.3.6.1.2.1.1
view   systemonly  included   .1.3.6.1.2.1.25.1
rocommunity  public default -V systemonly
rocommunity6 public default -V systemonly
rouser authPrivUser authpriv -V systemonly
</code></pre></div></div>

<p>To access more than just the <code class="language-plaintext highlighter-rouge">systemonly</code> view, you need to create a new view and reconfigure the <code class="language-plaintext highlighter-rouge">public</code> community string.</p>

<p><strong>Steps to Reconfigure the Public Community String for Read-Only All Access</strong>:</p>

<ol>
  <li><strong>Define the “all” View</strong>:
    <ul>
      <li>Edit the <code class="language-plaintext highlighter-rouge">/etc/snmp/snmpd.conf</code> file to include a new view that encompasses everything.</li>
    </ul>

    <div class="language-plaintext highlighter-rouge"><div class="highlight"><pre class="highlight"><code>view    all    included   .1
</code></pre></div>    </div>
  </li>
  <li><strong>Reconfigure the Public Community String</strong>:
    <ul>
      <li>Modify the community string to use the new <code class="language-plaintext highlighter-rouge">all</code> view.</li>
    </ul>

    <div class="language-plaintext highlighter-rouge"><div class="highlight"><pre class="highlight"><code>rocommunity  public  default  -V all
</code></pre></div>    </div>
  </li>
  <li><strong>Restart the SNMP Service</strong>:
    <ul>
      <li>After making the changes, restart the SNMP service to apply the new configuration.</li>
    </ul>

    <div class="language-bash highlighter-rouge"><div class="highlight"><pre class="highlight"><code><span class="nb">sudo </span>systemctl restart snmpd
</code></pre></div>    </div>
  </li>
</ol>

<p><strong>Security Considerations</strong>:</p>
<ul>
  <li>For the scope of this project, I will use SNMPv2c for simplicity, avoiding the additional complexity of SNMPv3.</li>
  <li>Be cautious with the <code class="language-plaintext highlighter-rouge">public</code> community string. In a production environment, it’s recommended to use a non-default community string or SNMPv3 for better security.</li>
  <li>While SNMP was originally designed to allow both monitoring and configuration (using the SET method), it is primarily used for monitoring. For this project, I recommend configuring SNMP for read-only access.</li>
</ul>

<h3 id="your-first-snmp-walk">Your First SNMP Walk</h3>

<p>To begin interacting with your SNMP agent, you can use the snmpwalk command. This command allows you to query a range of information from the SNMP agent, providing a detailed view of the system’s status and configuration.</p>

<p>In the example below, we use the head command to display only the first few lines of output to keep it brief for the sake of the write-up. As you can see from the line count, there are over 5,000 lines of output.</p>

<div class="language-plaintext highlighter-rouge"><div class="highlight"><pre class="highlight"><code>root@LA-SBC:/etc/snmp# snmpwalk -v2c -c public localhost | head -n 5
iso.3.6.1.2.1.1.1.0 = STRING: "Linux LA-SBC 5.10.0-33-amd64 #1 SMP Debian 5.10.226-1 (2024-10-03) x86_64"
iso.3.6.1.2.1.1.2.0 = OID: iso.3.6.1.4.1.8072.3.2.10
iso.3.6.1.2.1.1.3.0 = Timeticks: (6913) 0:01:09.13
iso.3.6.1.2.1.1.4.0 = STRING: "Me &lt;me@example.org&gt;"
iso.3.6.1.2.1.1.5.0 = STRING: "LA-SBC"
root@LA-SBC:/etc/snmp#
root@LA-SBC:/etc/snmp# snmpwalk -v2c -c public localhost | wc -l
5588
root@LA-SBC:/etc/snmp#
</code></pre></div></div>

<h2 id="extending-net-snmp-agent-with-custom-metrics">Extending Net-SNMP Agent with Custom Metrics</h2>

<p>When it comes to extending the Net-SNMP agent with custom metrics, there are several approaches you can take. Here we’ll discuss these options, starting with MIB Modules:</p>

<h3 id="mib-modules">MIB Modules</h3>

<p>MIB Modules are essentially the standard way of exposing data through Net-SNMP. They represent the full integration pathway used to collect and expose metrics such as NIC, filesystem, and other core Linux metrics. Here are some key points about MIB Modules:</p>

<ul>
  <li><strong>Language and Integration</strong>: MIB modules are generally written in the C programming language, which allows for close-to-the-metal performance and fine-grained control. These modules are compiled and then loaded by the Net-SNMP agent.</li>
  <li><strong>Usage and Documentation</strong>: There is extensive documentation provided by Net-SNMP on how to write, compile, and integrate these modules. This method is highly detailed and customizable, making it suitable for complex and large-scale integrations.</li>
  <li><strong>Typical Use Cases</strong>: Given the level of complexity and the integration effort required, this approach is often adopted by major hardware manufacturers or large organizations that need to integrate comprehensive monitoring capabilities across their products or infrastructure.</li>
  <li><strong>Overkill for Customizations</strong>: For localized customizations or simpler monitoring needs, MIB Modules are overkill. They require significant development resources and expertise in C programming.</li>
</ul>

<p>In summary, while MIB Modules provide a powerful and flexible way to extend Net-SNMP, they are beyond the needs of smaller projects.</p>

<h3 id="agentx">AgentX</h3>

<p>AgentX is a protocol for delegating parts of the SNMP OID address space to sub-agents, enabling distributed management of SNMP metrics. It is:</p>

<ul>
  <li>A <strong>standard approach</strong> for mature software projects to expose SNMP metrics. Before building custom solutions, check whether the software you need to monitor already supports SNMP via AgentX.</li>
  <li>A powerful tool for <strong>developing custom metrics</strong>, particularly when other SNMP extension mechanisms (e.g., <code class="language-plaintext highlighter-rouge">extend</code>, <code class="language-plaintext highlighter-rouge">pass</code>, or <code class="language-plaintext highlighter-rouge">pass_persist</code>) are insufficient. However, using AgentX for custom extensions is considered an advanced undertaking.</li>
</ul>

<p>Below are additional considerations:</p>

<ol>
  <li><strong>Zero-Config Delegation</strong>: AgentX enables nearly zero-configuration delegation of OID ranges to sub-agents via a Linux socket file or configurable UDP/TCP communication.</li>
  <li><strong>Custom Sub-Agents</strong>: If extending Net-SNMP through simpler mechanisms today, consider AgentX as your next step. Middleware solutions, such as those built with Python, can extract, transform, and manage metrics programmatically while integrating with AgentX.</li>
</ol>

<h4 id="ownership-and-permissions">Ownership and Permissions</h4>

<p>Proper ownership and permissions for the AgentX socket file are critical for successful integration:</p>
<ul>
  <li>Ensure your application has write access to the socket file. Below is an example <code class="language-plaintext highlighter-rouge">snmpd.conf</code> configuration that sets group ownership and write permissions for the group <code class="language-plaintext highlighter-rouge">freeswitch</code> (the group under which our sub-agent runs).</li>
  <li>Note the execute bit (<code class="language-plaintext highlighter-rouge">x</code>) is set on the directory, including for others. In UNIX, directory execute permissions allow traversal, which is essential.</li>
</ul>

<h4 id="example-snmpdconf-configuration">Example <code class="language-plaintext highlighter-rouge">snmpd.conf</code> Configuration</h4>

<div class="language-plaintext highlighter-rouge"><div class="highlight"><pre class="highlight"><code># Set up AgentX socket with group ownership and permissions
agentXSocket /var/agentx/master agentXPerms 0770 0711 root freeswitch
</code></pre></div></div>

<h3 id="pass_persist">pass_persist</h3>

<p>The <code class="language-plaintext highlighter-rouge">pass_persist</code> directive in Net-SNMP offers a dynamic and flexible way to handle SNMP data by delegating control of a specific OID subtree to an external script. Here’s what you need to know:</p>

<ul>
  <li><strong>Requires Developing a Script</strong>: The <code class="language-plaintext highlighter-rouge">pass_persist</code> protocol requires developing a script that can speak the Net-SNMP pass_persist protocol. Your script must handle more than just simple lookups; it must navigate the OID tree using SNMP semantics, responding to <code class="language-plaintext highlighter-rouge">get</code> and <code class="language-plaintext highlighter-rouge">getnext</code> requests, and maintain control over the subtree. This is essential for dynamic metrics, especially in tabular format.</li>
  <li><strong>Learning Opportunity</strong>: This hands-on approach provides a valuable learning experience: it forces you to understand and implement the SNMP protocol’s semantics yourself.</li>
  <li><strong>UNIX inetd Concept</strong>: This approach is similar to the UNIX <code class="language-plaintext highlighter-rouge">inetd</code> concept, which allows the implementation of network services merely by interfacing with standard input and output.</li>
  <li><strong>Most Accessible Method</strong>: <code class="language-plaintext highlighter-rouge">pass_persist</code> is the most accessible method for delegating portions of the OID tree to a sub-agent, which is critical for adding new metrics without needing to update the <code class="language-plaintext highlighter-rouge">snmpd</code> configuration.</li>
  <li><strong>Strategic Middle Ground</strong>: This method is ideal for those requiring precise control over which OIDs are used and how the hierarchy is defined. It allows for true space delegation, enabling dynamic metric data shipping without revisiting snmpd configuration for each individual metric.</li>
</ul>

<p><strong>Example snmpd.conf Configuration</strong>:</p>
<div class="language-plaintext highlighter-rouge"><div class="highlight"><pre class="highlight"><code>pass_persist .1.3.6.1.4.1.2021.255 /path/to/your_script.py
</code></pre></div></div>

<p>In this example, the <code class="language-plaintext highlighter-rouge">pass_persist</code> directive assigns the OID subtree rooted at <code class="language-plaintext highlighter-rouge">.1.3.6.1.4.1.2021.255</code> to the specified script. This script is now responsible for handling all SNMP requests within that subtree.</p>

<h3 id="extend">extend</h3>

<p>The <code class="language-plaintext highlighter-rouge">extend</code> directive in Net-SNMP is a straightforward method to integrate custom metrics into the SNMP agent, allowing you to extend its capabilities. Here’s what you need to know:</p>

<ul>
  <li><strong>Good for Unsupported Metrics</strong>: The <code class="language-plaintext highlighter-rouge">extend</code> directive is ideal for when a metric is not directly supported by SNMP but can be retrieved and printed out via a command-line shell script.</li>
  <li><strong>Simple Implementation</strong>: Unlike more complex methods such as <code class="language-plaintext highlighter-rouge">pass_persist</code> or MIB Modules, the <code class="language-plaintext highlighter-rouge">extend</code> directive is relatively simple to implement. You just need to specify the command to be executed.</li>
  <li><strong>Limited Control and Flexibility</strong>: Each custom metric must be individually specified in the <code class="language-plaintext highlighter-rouge">snmpd.conf</code> file, and you don’t get to customize the entire OID, only the final part of it.</li>
  <li><strong>Generally Adequate</strong>: This method is best suited for exporting a few well-established, stable custom metrics that do not have dynamic or frequently changing requirements.</li>
</ul>

<p><strong>Example snmpd.conf Configuration</strong>:</p>
<div class="language-plaintext highlighter-rouge"><div class="highlight"><pre class="highlight"><code># Extend SNMP with custom script
extend myCustomScript /path/to/my_script.sh
</code></pre></div></div>

<p>In this example, the <code class="language-plaintext highlighter-rouge">extend</code> directive assigns the script located at <code class="language-plaintext highlighter-rouge">/path/to/my_script.sh</code> to the identifier <code class="language-plaintext highlighter-rouge">myCustomScript</code>. The SNMP agent will execute this script whenever an SNMP request is made to that identifier.</p>

<p>The full OID will be structured as:</p>
<div class="language-plaintext highlighter-rouge"><div class="highlight"><pre class="highlight"><code>.1.3.6.1.4.1.8072.2.3.1.1.[index]
</code></pre></div></div>
<p>where <code class="language-plaintext highlighter-rouge">[index]</code> is a unique identifier for each <code class="language-plaintext highlighter-rouge">extend</code> instance. For example, if <code class="language-plaintext highlighter-rouge">myCustomScript</code> is the first instance, the OID might be:</p>
<div class="language-plaintext highlighter-rouge"><div class="highlight"><pre class="highlight"><code>.1.3.6.1.4.1.8072.2.3.1.1.1
</code></pre></div></div>

<h2 id="understanding-tabular-data-in-snmp">Understanding Tabular Data in SNMP</h2>

<p>The concept of tabular data in SNMP began with RFC 1066 (Aug 1988), laying the groundwork for structuring managed objects with tables. RFC 1213 (Mar 1991), expanded these definitions in MIB-II, providing a comprehensive framework for network management. Additionally, RFC 1155 (May 1990), known as SMI (Structure of Management Information), formalized the structure of management information, contributing to the standardization of tabular data in SNMP.</p>

<p>These RFCs collectively established the foundation for using tabular data in SNMP.</p>

<h3 id="the-logical-structure-of-snmp-tables">The Logical Structure of SNMP Tables</h3>

<p>At the core of an SNMP table is its base OID, which identifies the table itself. Columns within the table are further defined as offsets from this base OID, and each row is indexed by a unique identifier appended to these column-specific OIDs. For example, in the ifTable (interface table) defined in the IF-MIB, we see:</p>

<ul>
  <li><strong>Base OID</strong>: <code class="language-plaintext highlighter-rouge">.1.3.6.1.2.1.2.2.1</code></li>
  <li><strong>Column OIDs</strong>: Each column has a specific suffix, such as <code class="language-plaintext highlighter-rouge">.1</code> for <code class="language-plaintext highlighter-rouge">ifIndex</code>, <code class="language-plaintext highlighter-rouge">.2</code> for <code class="language-plaintext highlighter-rouge">ifDescr</code>, <code class="language-plaintext highlighter-rouge">.7</code> for <code class="language-plaintext highlighter-rouge">ifAdminStatus</code>, etc.</li>
  <li><strong>Row Indexing</strong>: Rows are identified by appending a row index to the column OID, e.g., <code class="language-plaintext highlighter-rouge">.1.3.6.1.2.1.2.2.1.2.1</code> refers to the <code class="language-plaintext highlighter-rouge">ifDescr</code> (description) of the first interface.</li>
</ul>

<p>This hierarchical structure is key to navigating SNMP tables programmatically and visually.</p>

<h3 id="visualizing-the-hierarchy">Visualizing the Hierarchy</h3>

<p>The following example from an SNMP walk demonstrates the canonical structure of the ifTable, focusing on three key columns: <code class="language-plaintext highlighter-rouge">ifIndex</code> (index), <code class="language-plaintext highlighter-rouge">ifDescr</code> (description), and <code class="language-plaintext highlighter-rouge">ifAdminStatus</code> (administrative status).</p>

<p><strong>SNMP Walk Output:</strong></p>
<div class="language-plaintext highlighter-rouge"><div class="highlight"><pre class="highlight"><code>.1.3.6.1.2.1.2.2.1.1.1 = INTEGER: 1
.1.3.6.1.2.1.2.2.1.1.2 = INTEGER: 2
.1.3.6.1.2.1.2.2.1.2.1 = STRING: lo
.1.3.6.1.2.1.2.2.1.2.2 = STRING: Red Hat, Inc. Device 0001
.1.3.6.1.2.1.2.2.1.7.1 = INTEGER: up(1)
.1.3.6.1.2.1.2.2.1.7.2 = INTEGER: up(1)
</code></pre></div></div>

<p><strong>Breaking this down:</strong></p>

<ul>
  <li><strong>Base OID</strong>: <code class="language-plaintext highlighter-rouge">.1.3.6.1.2.1.2.2.1</code></li>
  <li><strong>Columns</strong>:
    <ul>
      <li><code class="language-plaintext highlighter-rouge">.1</code> (<code class="language-plaintext highlighter-rouge">ifIndex</code>) identifies the interface.</li>
      <li><code class="language-plaintext highlighter-rouge">.2</code> (<code class="language-plaintext highlighter-rouge">ifDescr</code>) provides a textual description of the interface.</li>
      <li><code class="language-plaintext highlighter-rouge">.7</code> (<code class="language-plaintext highlighter-rouge">ifAdminStatus</code>) indicates whether the interface is administratively up or down.</li>
    </ul>
  </li>
  <li><strong>Rows</strong>: The index at the end (e.g., <code class="language-plaintext highlighter-rouge">1</code>, <code class="language-plaintext highlighter-rouge">2</code>) corresponds to a specific interface.</li>
</ul>

<p><strong>Tabular Representation:</strong></p>

<table>
  <thead>
    <tr>
      <th>Index (.1)</th>
      <th>Description (.2)</th>
      <th>Admin Status (.7)</th>
    </tr>
  </thead>
  <tbody>
    <tr>
      <td>1</td>
      <td>lo</td>
      <td>up (1)</td>
    </tr>
    <tr>
      <td>2</td>
      <td>Red Hat, Inc. Device 0001</td>
      <td>up (1)</td>
    </tr>
  </tbody>
</table>

<h3 id="key-takeaways">Key Takeaways</h3>

<ol>
  <li><strong>Established Standards</strong>: The structure of SNMP tables follows standards defined in RFCs and MIBs, ensuring predictable and consistent data access.</li>
  <li><strong>Hierarchical Mapping</strong>: Base OIDs anchor tables, while column and row indices extend these anchors to form a complete data path.</li>
</ol>

<h3 id="application-to-modern-monitoring">Application to Modern Monitoring</h3>

<p>Modern monitoring platforms leverage this hierarchical SNMP model to automatically discover and integrate system resources, both at initial deployment and over time. This dynamic discovery is crucial for ensuring continuous and accurate monitoring, as it eliminates the need for manual configuration updates when systems change.</p>

<p>For example:</p>

<ul>
  <li><strong>Scenario 1</strong>: A new filesystem is created on a server. The monitoring platform should automatically detect the addition of the filesystem and begin applying the correct monitoring policies (e.g., disk space usage, inode usage).</li>
  <li><strong>Scenario 2</strong>: A new network interface card (NIC) is added. The system should detect the NIC, fetch its status, and monitor traffic accordingly.</li>
</ul>

<hr />
<h2 id="proof-of-concept-custom-metrics-integration">Proof of Concept: Custom Metrics Integration</h2>
<p>Building on insights from my initial exploration of Net-SNMP, I am now set to embark on a proof of concept (PoC) for integrating custom metrics into and through Net-SNMP to SolarWinds.</p>

<h3 id="choosing-an-extension-mechanism-pass_persist">Choosing an extension mechanism: pass_persist</h3>

<p>When evaluating ways to extend Net-SNMP with custom metrics, I chose the pass_persist option. It provides the necessary control over the OID space, supports hierarchical structures for tables, and allows dynamic updates to items without requiring changes to the snmpd configuration.</p>

<h4 id="initial-considerations">Initial Considerations</h4>

<p>The main challenge is developing a script that adheres to SNMP semantics. To address this, I’ll begin with a prototyping approach, focusing on establishing a reliable method for passing data to Net-SNMP. Using dummy data in the initial phase ensures the framework is solid and minimizes the risk of wasted effort from false starts.</p>

<h4 id="prototyping-with-dummy-data">Prototyping with Dummy Data</h4>

<p>Prototyping is a practical strategy when requirements are evolving or unclear. In this case, I need to integrate custom metrics into Net-SNMP while preparing for future SolarWinds integration. Given the uncertainty and investigative nature of the SolarWinds phase, prototyping ensures flexibility and minimizes wasted effort if I have to circle back. It also helps to break the problem into manageable chunks, allowing me to start with minimal effort and adapt as needed.</p>

<p>To prototype effectively, I’ll use the filesystem as a simple storage backend. This decision allows me to focus on two key tasks:</p>
<ul>
  <li><strong>Implementing the pass_persist Protocol</strong>: I’ll concentrate on refining the pass_persist protocol—writing, debugging, and iterating the script, with log files and packet captures guiding the process. The goal is to stabilize the script’s functionality, ensuring it can parse requests, navigate the tree structure, and respond appropriately with detailed logs for debugging.</li>
  <li><strong>Mastering the OID Hierarchy for Tabular Data</strong>: Once the script is solid, attention will shift to optimizing the OID hierarchy. Using basic disk files enables rapid iteration on the data structure without disrupting the script’s stability, ensuring efficient experimentation with different hierarchies.</li>
</ul>

<p>Ultimately, the entire approach is a prototype solution aimed at solidifying my methodology before deploying the actual custom metrics.</p>

<h4 id="implementing-the-pass_persist-protocol">Implementing the pass_persist Protocol</h4>

<p>The pass_persist directive in Net-SNMP is a powerful tool that delegates control over an OID subtree to an external script. Unlike the simpler pass, which executes a new script for each SNMP request, pass_persist keeps the script running continuously, reducing overhead and benefiting dynamic or frequently updated metrics.</p>

<h4 id="a-bash-implementation">A Bash Implementation</h4>

<p>The following Bash script implements the <code class="language-plaintext highlighter-rouge">pass_persist</code> protocol. It dynamically traverses an OID tree and supports <code class="language-plaintext highlighter-rouge">PING</code>, <code class="language-plaintext highlighter-rouge">get</code>, <code class="language-plaintext highlighter-rouge">getnext</code>, and <code class="language-plaintext highlighter-rouge">getbulk</code> commands. Logs are written to <code class="language-plaintext highlighter-rouge">/tmp/read_oid_persist.log</code> for debugging purposes.</p>

<div class="language-bash highlighter-rouge"><div class="highlight"><pre class="highlight"><code><span class="c">#!/bin/bash</span>
<span class="nv">LOG_FILE</span><span class="o">=</span><span class="s2">"/tmp/read_oid_persist.log"</span>

<span class="nb">echo</span> <span class="s2">"</span><span class="si">$(</span><span class="nb">date</span><span class="si">)</span><span class="s2"> - Starting read_oid_persist.sh"</span> <span class="o">&gt;&gt;</span> <span class="s2">"</span><span class="nv">$LOG_FILE</span><span class="s2">"</span>

<span class="k">while </span><span class="nb">true</span><span class="p">;</span> <span class="k">do
    </span><span class="nb">read </span>CMD
    <span class="nb">echo</span> <span class="s2">"</span><span class="si">$(</span><span class="nb">date</span><span class="si">)</span><span class="s2"> - Command: </span><span class="nv">$CMD</span><span class="s2">"</span> <span class="o">&gt;&gt;</span> <span class="s2">"</span><span class="nv">$LOG_FILE</span><span class="s2">"</span>

    <span class="k">if</span> <span class="o">[</span> <span class="s2">"</span><span class="nv">$CMD</span><span class="s2">"</span> <span class="o">==</span> <span class="s2">"PING"</span> <span class="o">]</span><span class="p">;</span> <span class="k">then
        </span><span class="nb">echo</span> <span class="s2">"PONG"</span>
        <span class="nb">echo</span> <span class="s2">"</span><span class="si">$(</span><span class="nb">date</span><span class="si">)</span><span class="s2"> - Responding to PING with PONG"</span> <span class="o">&gt;&gt;</span> <span class="s2">"</span><span class="nv">$LOG_FILE</span><span class="s2">"</span>
    <span class="k">else
        </span><span class="nb">read </span>OID
        <span class="nb">echo</span> <span class="s2">"</span><span class="si">$(</span><span class="nb">date</span><span class="si">)</span><span class="s2"> - OID: </span><span class="nv">$OID</span><span class="s2">"</span> <span class="o">&gt;&gt;</span> <span class="s2">"</span><span class="nv">$LOG_FILE</span><span class="s2">"</span>

        <span class="k">if</span> <span class="o">[</span> <span class="s2">"</span><span class="nv">$CMD</span><span class="s2">"</span> <span class="o">==</span> <span class="s2">"get"</span> <span class="o">]</span><span class="p">;</span> <span class="k">then
            if</span> <span class="o">[</span> <span class="nt">-f</span> <span class="s2">"/oids/</span><span class="nv">$OID</span><span class="s2">"</span> <span class="o">]</span><span class="p">;</span> <span class="k">then
                </span><span class="nv">VALUE</span><span class="o">=</span><span class="si">$(</span><span class="nb">cat</span> <span class="s2">"/oids/</span><span class="nv">$OID</span><span class="s2">"</span><span class="si">)</span>
                <span class="nv">TYPE</span><span class="o">=</span><span class="s2">"STRING"</span>
                <span class="k">if</span> <span class="o">[[</span> <span class="s2">"</span><span class="nv">$VALUE</span><span class="s2">"</span> <span class="o">=</span>~ ^[0-9]+<span class="nv">$ </span><span class="o">]]</span><span class="p">;</span> <span class="k">then
                    </span><span class="nv">TYPE</span><span class="o">=</span><span class="s2">"INTEGER"</span>
                <span class="k">fi
                </span><span class="nb">echo</span> <span class="s2">"</span><span class="nv">$OID</span><span class="s2">"</span>
                <span class="nb">echo</span> <span class="s2">"</span><span class="nv">$TYPE</span><span class="s2">"</span>
                <span class="nb">echo</span> <span class="s2">"</span><span class="nv">$VALUE</span><span class="s2">"</span>
                <span class="nb">echo</span> <span class="s2">"</span><span class="si">$(</span><span class="nb">date</span><span class="si">)</span><span class="s2"> - Returning value: </span><span class="nv">$VALUE</span><span class="s2"> for OID: </span><span class="nv">$OID</span><span class="s2">, Type: </span><span class="nv">$TYPE</span><span class="s2">"</span> <span class="o">&gt;&gt;</span> <span class="s2">"</span><span class="nv">$LOG_FILE</span><span class="s2">"</span>
            <span class="k">else
                </span><span class="nb">echo</span> <span class="s2">"NONE"</span>
                <span class="nb">echo</span> <span class="s2">"</span><span class="si">$(</span><span class="nb">date</span><span class="si">)</span><span class="s2"> - OID not found: </span><span class="nv">$OID</span><span class="s2">"</span> <span class="o">&gt;&gt;</span> <span class="s2">"</span><span class="nv">$LOG_FILE</span><span class="s2">"</span>
            <span class="k">fi
        elif</span> <span class="o">[</span> <span class="s2">"</span><span class="nv">$CMD</span><span class="s2">"</span> <span class="o">==</span> <span class="s2">"getnext"</span> <span class="o">]</span><span class="p">;</span> <span class="k">then
            </span><span class="nv">NEXT_OID</span><span class="o">=</span><span class="si">$(</span><span class="nb">ls</span> <span class="nt">-A</span> /oids | <span class="nb">grep</span> <span class="nt">-A</span> 1 <span class="s2">"^</span><span class="nv">$OID</span><span class="se">\$</span><span class="s2">"</span> | <span class="nb">tail</span> <span class="nt">-n</span> 1<span class="si">)</span>
            <span class="k">if</span> <span class="o">[</span> <span class="nt">-f</span> <span class="s2">"/oids/</span><span class="nv">$NEXT_OID</span><span class="s2">"</span> <span class="o">]</span><span class="p">;</span> <span class="k">then
                </span><span class="nv">VALUE</span><span class="o">=</span><span class="si">$(</span><span class="nb">cat</span> <span class="s2">"/oids/</span><span class="nv">$NEXT_OID</span><span class="s2">"</span><span class="si">)</span>
                <span class="nv">TYPE</span><span class="o">=</span><span class="s2">"STRING"</span>
                <span class="k">if</span> <span class="o">[[</span> <span class="s2">"</span><span class="nv">$VALUE</span><span class="s2">"</span> <span class="o">=</span>~ ^[0-9]+<span class="nv">$ </span><span class="o">]]</span><span class="p">;</span> <span class="k">then
                    </span><span class="nv">TYPE</span><span class="o">=</span><span class="s2">"INTEGER"</span>
                <span class="k">fi
                </span><span class="nb">echo</span> <span class="s2">"</span><span class="nv">$NEXT_OID</span><span class="s2">"</span>
                <span class="nb">echo</span> <span class="s2">"</span><span class="nv">$TYPE</span><span class="s2">"</span>
                <span class="nb">echo</span> <span class="s2">"</span><span class="nv">$VALUE</span><span class="s2">"</span>
                <span class="nb">echo</span> <span class="s2">"</span><span class="si">$(</span><span class="nb">date</span><span class="si">)</span><span class="s2"> - Returning next OID: </span><span class="nv">$NEXT_OID</span><span class="s2"> with value: </span><span class="nv">$VALUE</span><span class="s2">, Type: </span><span class="nv">$TYPE</span><span class="s2">"</span> <span class="o">&gt;&gt;</span> <span class="s2">"</span><span class="nv">$LOG_FILE</span><span class="s2">"</span>
            <span class="k">else
                </span><span class="nb">echo</span> <span class="s2">"NONE"</span>
                <span class="nb">echo</span> <span class="s2">"</span><span class="si">$(</span><span class="nb">date</span><span class="si">)</span><span class="s2"> - Next OID not found after: </span><span class="nv">$OID</span><span class="s2">"</span> <span class="o">&gt;&gt;</span> <span class="s2">"</span><span class="nv">$LOG_FILE</span><span class="s2">"</span>
            <span class="k">fi
        elif</span> <span class="o">[</span> <span class="s2">"</span><span class="nv">$CMD</span><span class="s2">"</span> <span class="o">==</span> <span class="s2">"getbulk"</span> <span class="o">]</span><span class="p">;</span> <span class="k">then
            </span><span class="nb">read </span>NON_REPEATERS MAX_REPETITIONS
            <span class="nv">RESULTS</span><span class="o">=()</span>
            <span class="nv">CURRENT_OID</span><span class="o">=</span><span class="nv">$OID</span>

            <span class="k">for</span> <span class="o">((</span> <span class="nv">i</span><span class="o">=</span>0<span class="p">;</span> i&lt;<span class="nv">$NON_REPEATERS</span><span class="p">;</span> i++ <span class="o">))</span><span class="p">;</span> <span class="k">do
                if</span> <span class="o">[</span> <span class="nt">-f</span> <span class="s2">"/oids/</span><span class="nv">$CURRENT_OID</span><span class="s2">"</span> <span class="o">]</span><span class="p">;</span> <span class="k">then
                    </span><span class="nv">VALUE</span><span class="o">=</span><span class="si">$(</span><span class="nb">cat</span> <span class="s2">"/oids/</span><span class="nv">$CURRENT_OID</span><span class="s2">"</span><span class="si">)</span>
                    <span class="nv">TYPE</span><span class="o">=</span><span class="s2">"STRING"</span>
                    <span class="k">if</span> <span class="o">[[</span> <span class="s2">"</span><span class="nv">$VALUE</span><span class="s2">"</span> <span class="o">=</span>~ ^[0-9]+<span class="nv">$ </span><span class="o">]]</span><span class="p">;</span> <span class="k">then
                        </span><span class="nv">TYPE</span><span class="o">=</span><span class="s2">"INTEGER"</span>
                    <span class="k">fi
                    </span>RESULTS+<span class="o">=(</span><span class="s2">"</span><span class="nv">$CURRENT_OID</span><span class="s2">"</span><span class="o">)</span>
                    RESULTS+<span class="o">=(</span><span class="s2">"</span><span class="nv">$TYPE</span><span class="s2">"</span><span class="o">)</span>
                    RESULTS+<span class="o">=(</span><span class="s2">"</span><span class="nv">$VALUE</span><span class="s2">"</span><span class="o">)</span>
                <span class="k">fi
                </span><span class="nv">CURRENT_OID</span><span class="o">=</span><span class="si">$(</span><span class="nb">ls</span> <span class="nt">-A</span> /oids | <span class="nb">grep</span> <span class="nt">-A</span> 1 <span class="s2">"^</span><span class="nv">$CURRENT_OID</span><span class="se">\$</span><span class="s2">"</span> | <span class="nb">tail</span> <span class="nt">-n</span> 1<span class="si">)</span>
            <span class="k">done

            for</span> <span class="o">((</span> <span class="nv">i</span><span class="o">=</span>0<span class="p">;</span> i&lt;<span class="nv">$MAX_REPETITIONS</span><span class="p">;</span> i++ <span class="o">))</span><span class="p">;</span> <span class="k">do
                if</span> <span class="o">[</span> <span class="nt">-f</span> <span class="s2">"/oids/</span><span class="nv">$CURRENT_OID</span><span class="s2">"</span> <span class="o">]</span><span class="p">;</span> <span class="k">then
                    </span><span class="nv">VALUE</span><span class="o">=</span><span class="si">$(</span><span class="nb">cat</span> <span class="s2">"/oids/</span><span class="nv">$CURRENT_OID</span><span class="s2">"</span><span class="si">)</span>
                    <span class="nv">TYPE</span><span class="o">=</span><span class="s2">"STRING"</span>
                    <span class="k">if</span> <span class="o">[[</span> <span class="s2">"</span><span class="nv">$VALUE</span><span class="s2">"</span> <span class="o">=</span>~ ^[0-9]+<span class="nv">$ </span><span class="o">]]</span><span class="p">;</span> <span class="k">then
                        </span><span class="nv">TYPE</span><span class="o">=</span><span class="s2">"INTEGER"</span>
                    <span class="k">fi
                    </span>RESULTS+<span class="o">=(</span><span class="s2">"</span><span class="nv">$CURRENT_OID</span><span class="s2">"</span><span class="o">)</span>
                    RESULTS+<span class="o">=(</span><span class="s2">"</span><span class="nv">$TYPE</span><span class="s2">"</span><span class="o">)</span>
                    RESULTS+<span class="o">=(</span><span class="s2">"</span><span class="nv">$VALUE</span><span class="s2">"</span><span class="o">)</span>
                <span class="k">fi
                </span><span class="nv">CURRENT_OID</span><span class="o">=</span><span class="si">$(</span><span class="nb">ls</span> <span class="nt">-A</span> /oids | <span class="nb">grep</span> <span class="nt">-A</span> 1 <span class="s2">"^</span><span class="nv">$CURRENT_OID</span><span class="se">\$</span><span class="s2">"</span> | <span class="nb">tail</span> <span class="nt">-n</span> 1<span class="si">)</span>
            <span class="k">done

            for </span>RESULT <span class="k">in</span> <span class="s2">"</span><span class="k">${</span><span class="nv">RESULTS</span><span class="p">[@]</span><span class="k">}</span><span class="s2">"</span><span class="p">;</span> <span class="k">do
                </span><span class="nb">echo</span> <span class="s2">"</span><span class="nv">$RESULT</span><span class="s2">"</span>
            <span class="k">done

            </span><span class="nb">echo</span> <span class="s2">"</span><span class="si">$(</span><span class="nb">date</span><span class="si">)</span><span class="s2"> - Returning bulk results for OID: </span><span class="nv">$OID</span><span class="s2">"</span> <span class="o">&gt;&gt;</span> <span class="s2">"</span><span class="nv">$LOG_FILE</span><span class="s2">"</span>
        <span class="k">else
            </span><span class="nb">echo</span> <span class="s2">"NONE"</span>
            <span class="nb">echo</span> <span class="s2">"</span><span class="si">$(</span><span class="nb">date</span><span class="si">)</span><span class="s2"> - Unknown command: </span><span class="nv">$CMD</span><span class="s2">"</span> <span class="o">&gt;&gt;</span> <span class="s2">"</span><span class="nv">$LOG_FILE</span><span class="s2">"</span>
        <span class="k">fi
    fi
done</span>
</code></pre></div></div>

<h4 id="introducing-the-dummy-data-script">Introducing the Dummy Data Script</h4>

<p>This script uses plain disk files for SNMP responses, ensuring the data structure is self-documenting and easy to replicate. It allows for quick iterations and clear debugging, validating the pass_persist implementation without the need for live metrics.</p>

<div class="language-bash highlighter-rouge"><div class="highlight"><pre class="highlight"><code><span class="c">#!/bin/bash</span>

<span class="c"># --------------------------------------------------------------------</span>
<span class="c"># SNMP Table Prototype Script: Gateway Status and Call Counts</span>
<span class="c">#</span>
<span class="c"># This script creates a single SNMP table with the following structure:</span>
<span class="c"># - Base OID: .1.3.6.1.4.1.9999.10701.1 (gatewayTable)</span>
<span class="c"># - Columns:</span>
<span class="c">#     .1 -&gt; gatewayIndex     (INTEGER: Index of the gateway)</span>
<span class="c">#     .2 -&gt; gatewayDescr     (STRING: Description of the gateway)</span>
<span class="c">#     .3 -&gt; gatewayStatus    (INTEGER: 1=UP, 2=DOWN)</span>
<span class="c">#     .4 -&gt; gatewayCalls     (INTEGER: Number of active calls)</span>
<span class="c">#</span>
<span class="c"># Data rows:</span>
<span class="c">#   - Index 1: chi-sbc, UP, 23 calls</span>
<span class="c">#   - Index 2: la-sbc, DOWN, 15 calls</span>
<span class="c">#</span>
<span class="c"># This layout mimics the structure of IF-MIB tables and ensures all anchor</span>
<span class="c"># OIDs are explicitly created for proper operation with pass_persist.</span>
<span class="c"># --------------------------------------------------------------------</span>

<span class="c"># Step 1: Create the anchor for the table base OID</span>
<span class="nb">mkdir</span> <span class="nt">-p</span> /oids
<span class="nb">echo</span> <span class="s2">"gatewayTable"</span> <span class="o">&gt;</span> /oids/.1.3.6.1.4.1.9999.10701.1

<span class="c"># --------------------------------------------------------------------</span>
<span class="c"># Column Anchors</span>
<span class="c"># --------------------------------------------------------------------</span>
<span class="nb">echo</span> <span class="s2">"gatewayIndex"</span>     <span class="o">&gt;</span> /oids/.1.3.6.1.4.1.9999.10701.1.1
<span class="nb">echo</span> <span class="s2">"gatewayDescr"</span>     <span class="o">&gt;</span> /oids/.1.3.6.1.4.1.9999.10701.1.2
<span class="nb">echo</span> <span class="s2">"gatewayStatus"</span>    <span class="o">&gt;</span> /oids/.1.3.6.1.4.1.9999.10701.1.3
<span class="nb">echo</span> <span class="s2">"gatewayCalls"</span>     <span class="o">&gt;</span> /oids/.1.3.6.1.4.1.9999.10701.1.4

<span class="c"># --------------------------------------------------------------------</span>
<span class="c"># Row Definitions</span>
<span class="c"># --------------------------------------------------------------------</span>

<span class="c"># Row 1: chi-sbc</span>
<span class="nb">echo</span> <span class="s2">"1"</span>                <span class="o">&gt;</span> /oids/.1.3.6.1.4.1.9999.10701.1.1.1    <span class="c"># Row 1, Column 1 (Index)</span>
<span class="nb">echo</span> <span class="s2">"chi-sbc"</span>          <span class="o">&gt;</span> /oids/.1.3.6.1.4.1.9999.10701.1.2.1    <span class="c"># Row 1, Column 2 (Description)</span>
<span class="nb">echo</span> <span class="s2">"1"</span>                <span class="o">&gt;</span> /oids/.1.3.6.1.4.1.9999.10701.1.3.1    <span class="c"># Row 1, Column 3 (Status: UP)</span>
<span class="nb">echo</span> <span class="s2">"23"</span>               <span class="o">&gt;</span> /oids/.1.3.6.1.4.1.9999.10701.1.4.1    <span class="c"># Row 1, Column 4 (Calls)</span>

<span class="c"># Row 2: la-sbc</span>
<span class="nb">echo</span> <span class="s2">"2"</span>                <span class="o">&gt;</span> /oids/.1.3.6.1.4.1.9999.10701.1.1.2    <span class="c"># Row 2, Column 1 (Index)</span>
<span class="nb">echo</span> <span class="s2">"la-sbc"</span>           <span class="o">&gt;</span> /oids/.1.3.6.1.4.1.9999.10701.1.2.2    <span class="c"># Row 2, Column 2 (Description)</span>
<span class="nb">echo</span> <span class="s2">"2"</span>                <span class="o">&gt;</span> /oids/.1.3.6.1.4.1.9999.10701.1.3.2    <span class="c"># Row 2, Column 3 (Status: DOWN)</span>
<span class="nb">echo</span> <span class="s2">"15"</span>               <span class="o">&gt;</span> /oids/.1.3.6.1.4.1.9999.10701.1.4.2    <span class="c"># Row 2, Column 4 (Calls)</span>

<span class="c"># Completion Message</span>
<span class="nb">echo</span> <span class="s2">"SNMP table structure created successfully."</span>

<span class="c"># --------------------------------------------------------------------</span>
<span class="c"># Notes:</span>
<span class="c"># - This table uses OIDs under the private enterprise tree (1.3.6.1.4.1).</span>
<span class="c"># - Example `snmpwalk` command for testing:</span>
<span class="c">#   snmpwalk -v2c -c public localhost .1.3.6.1.4.1.9999.10701.1</span>
<span class="c"># --------------------------------------------------------------------</span>
</code></pre></div></div>

<h3 id="validating-the-pass_persist-implementation">Validating the pass_persist Implementation</h3>

<p>A tremendous amount of developer testing went into this, involving hundreds of test invocations, detailed log analysis, and live packet captures. This was a rigorous process aimed at ensuring everything worked as expected across different scenarios.</p>

<p>The following section presents just the final validation steps, which confirm that the implementation is functioning as intended. Keep in mind, this is the culmination of extensive testing and iterative improvements.</p>

<p>Here’s the configured snmpd.conf line for the pass_persist directive:</p>

<div class="language-bash highlighter-rouge"><div class="highlight"><pre class="highlight"><code>root@NY-SBC:/# <span class="nb">tail</span> <span class="nt">-n</span> 1 /etc/snmp/snmpd.conf
pass_persist .1.3.6.1.4.1.9999.10701.1 /usr/bin/bash /usr/local/scripts/read_oid_persist.sh
root@NY-SBC:/#
</code></pre></div></div>

<p>Let’s try some SNMP walks of the whole table as well as each column:</p>

<div class="language-plaintext highlighter-rouge"><div class="highlight"><pre class="highlight"><code>root@NY-SBC:/#  snmpwalk -v2c -c public localhost .1.3.6.1.4.1.9999.10701.1
SNMPv2-SMI::enterprises.9999.10701.1.1 = STRING: "gatewayIndex"
SNMPv2-SMI::enterprises.9999.10701.1.1.1 = INTEGER: 1
SNMPv2-SMI::enterprises.9999.10701.1.1.2 = INTEGER: 2
SNMPv2-SMI::enterprises.9999.10701.1.2 = STRING: "gatewayDescr"
SNMPv2-SMI::enterprises.9999.10701.1.2.1 = STRING: "chi-sbc"
SNMPv2-SMI::enterprises.9999.10701.1.2.2 = STRING: "la-sbc"
SNMPv2-SMI::enterprises.9999.10701.1.3 = STRING: "gatewayStatus"
SNMPv2-SMI::enterprises.9999.10701.1.3.1 = INTEGER: 1
SNMPv2-SMI::enterprises.9999.10701.1.3.2 = INTEGER: 2
SNMPv2-SMI::enterprises.9999.10701.1.4 = STRING: "gatewayCalls"
SNMPv2-SMI::enterprises.9999.10701.1.4.1 = INTEGER: 23
SNMPv2-SMI::enterprises.9999.10701.1.4.2 = INTEGER: 15
root@NY-SBC:/#
root@NY-SBC:/#
root@NY-SBC:/#  snmpwalk -v2c -c public localhost .1.3.6.1.4.1.9999.10701.1.1
SNMPv2-SMI::enterprises.9999.10701.1.1.1 = INTEGER: 1
SNMPv2-SMI::enterprises.9999.10701.1.1.2 = INTEGER: 2
root@NY-SBC:/#
root@NY-SBC:/#
root@NY-SBC:/#  snmpwalk -v2c -c public localhost .1.3.6.1.4.1.9999.10701.1.2
SNMPv2-SMI::enterprises.9999.10701.1.2.1 = STRING: "chi-sbc"
SNMPv2-SMI::enterprises.9999.10701.1.2.2 = STRING: "la-sbc"
root@NY-SBC:/#
root@NY-SBC:/#  snmpwalk -v2c -c public localhost .1.3.6.1.4.1.9999.10701.1.3
SNMPv2-SMI::enterprises.9999.10701.1.3.1 = INTEGER: 1
SNMPv2-SMI::enterprises.9999.10701.1.3.2 = INTEGER: 2
root@NY-SBC:/#
root@NY-SBC:/#  snmpwalk -v2c -c public localhost .1.3.6.1.4.1.9999.10701.1.4
SNMPv2-SMI::enterprises.9999.10701.1.4.1 = INTEGER: 23
SNMPv2-SMI::enterprises.9999.10701.1.4.2 = INTEGER: 15
root@NY-SBC:/#
</code></pre></div></div>

<p>I also tried SNMP bulk walks, which correspond to the ‘GET TABLE’ idea we’ll eventually encounter in SolarWinds.  These utilize a different mechanism at the SNMP protocol level and exercise a different code path in our pass_persist script:</p>

<div class="language-plaintext highlighter-rouge"><div class="highlight"><pre class="highlight"><code>root@NY-SBC:/# snmpbulkwalk -v2c -c public localhost .1.3.6.1.4.1.9999.10701.1
SNMPv2-SMI::enterprises.9999.10701.1.1 = STRING: "gatewayIndex"
SNMPv2-SMI::enterprises.9999.10701.1.1.1 = INTEGER: 1
SNMPv2-SMI::enterprises.9999.10701.1.1.2 = INTEGER: 2
SNMPv2-SMI::enterprises.9999.10701.1.2 = STRING: "gatewayDescr"
SNMPv2-SMI::enterprises.9999.10701.1.2.1 = STRING: "chi-sbc"
SNMPv2-SMI::enterprises.9999.10701.1.2.2 = STRING: "la-sbc"
SNMPv2-SMI::enterprises.9999.10701.1.3 = STRING: "gatewayStatus"
SNMPv2-SMI::enterprises.9999.10701.1.3.1 = INTEGER: 1
SNMPv2-SMI::enterprises.9999.10701.1.3.2 = INTEGER: 2
SNMPv2-SMI::enterprises.9999.10701.1.4 = STRING: "gatewayCalls"
SNMPv2-SMI::enterprises.9999.10701.1.4.1 = INTEGER: 23
SNMPv2-SMI::enterprises.9999.10701.1.4.2 = INTEGER: 15
root@NY-SBC:/#
root@NY-SBC:/# snmpbulkwalk -v2c -c public localhost .1.3.6.1.4.1.9999.10701.1.1
SNMPv2-SMI::enterprises.9999.10701.1.1.1 = INTEGER: 1
SNMPv2-SMI::enterprises.9999.10701.1.1.2 = INTEGER: 2
root@NY-SBC:/#
root@NY-SBC:/# snmpbulkwalk -v2c -c public localhost .1.3.6.1.4.1.9999.10701.1.2
SNMPv2-SMI::enterprises.9999.10701.1.2.1 = STRING: "chi-sbc"
SNMPv2-SMI::enterprises.9999.10701.1.2.2 = STRING: "la-sbc"
root@NY-SBC:/#
root@NY-SBC:/# snmpbulkwalk -v2c -c public localhost .1.3.6.1.4.1.9999.10701.1.3
SNMPv2-SMI::enterprises.9999.10701.1.3.1 = INTEGER: 1
SNMPv2-SMI::enterprises.9999.10701.1.3.2 = INTEGER: 2
root@NY-SBC:/#
</code></pre></div></div>

<p>Finally let’s try some random gets, walks, etc. against individual OIDs, just to see if we can uncover any issues:</p>

<div class="language-plaintext highlighter-rouge"><div class="highlight"><pre class="highlight"><code>root@NY-SBC:/# snmpbulkwalk -v2c -c public localhost .1.3.6.1.4.1.9999.10701.1.3.1
SNMPv2-SMI::enterprises.9999.10701.1.3.1 = INTEGER: 1
root@NY-SBC:/#
root@NY-SBC:/# snmpwalk -v2c -c public localhost .1.3.6.1.4.1.9999.10701.1.3.1
SNMPv2-SMI::enterprises.9999.10701.1.3.1 = INTEGER: 1
root@NY-SBC:/#
root@NY-SBC:/# snmpget -v2c -c public localhost .1.3.6.1.4.1.9999.10701.1.3.1
SNMPv2-SMI::enterprises.9999.10701.1.3.1 = INTEGER: 1
root@NY-SBC:/#
root@NY-SBC:/# snmpget -v2c -c public localhost .1.3.6.1.4.1.9999.10701.1.3.2
SNMPv2-SMI::enterprises.9999.10701.1.3.2 = INTEGER: 2
root@NY-SBC:/#
root@NY-SBC:/# snmpget -v2c -c public localhost .1.3.6.1.4.1.9999.10701.1.4.2
SNMPv2-SMI::enterprises.9999.10701.1.4.2 = INTEGER: 15
root@NY-SBC:/#
</code></pre></div></div>

<h3 id="integration-with-solarwinds">Integration with SolarWinds</h3>

<p>As part of the integration process for monitoring custom metrics from the SBCs into SolarWinds, I utilized SolarWinds’ UnDP (Universal Device Poller) tool to import the necessary SNMP data. This approach enabled me to retrieve a variety of metrics, including the dynamic discovery of connected SIP trunks.</p>

<h3 id="undp-tool-overview">UnDP Tool Overview</h3>

<p>The UnDP tool offers flexibility for importing custom SNMP data, yet neither it nor SolarWinds’ main web UI support importing custom MIB files. To add a custom MIB to the monitoring system, you must submit the MIB file through SolarWinds support channels. They will then package it into a fleet-wide “database update,” as there is no supported way to perform a custom MIB import independently.</p>

<p>For this project, I leveraged the tool’s existing capabilities to import table-based data from the SBC using the “GET TABLE” functionality. Although the UnDP tool allows the definition of custom metrics without a MIB definition, there are limitations when dealing with custom metrics not covered by an imported MIB.</p>

<h3 id="challenges-and-solutions">Challenges and Solutions</h3>
<p>One of the main challenges I encountered was the lack of granular control over table formatting and labeling when using the “GET TABLE” feature. The UnDP tool does not offer per-column formatting options, which impacted how the data was displayed in the SolarWinds UI. Despite this limitation, I was able to configure table imports and implement essential monitoring functions, such as a working test alert for trunk status changes.</p>

<p>Although the tool does not fully align with the SNMP community’s standard for tabular data, it still allows for column-at-once polling, providing a reasonable compromise. With further adjustments, such as refining metric labeling and adjusting the display format, these limitations can be addressed to enhance the overall integration.</p>

<h3 id="conclusion">Conclusion</h3>

<p>This proof of concept (PoC) demonstrates the successful integration of custom SNMP metrics with SolarWinds, meeting the immediate need for monitoring SIP trunk statuses. While it does not yet showcase advanced dashboards or fully customized metric displays, it sets a solid foundation for future enhancements.</p>

<p>I am eager to further explore SolarWinds’ capabilities and refine the configuration to create a more robust and dynamic monitoring solution. Given the opportunity to join your team, I am committed to mastering SolarWinds and delivering a polished, comprehensive integration.</p>

<h3 id="screenshots">Screenshots</h3>

<p>
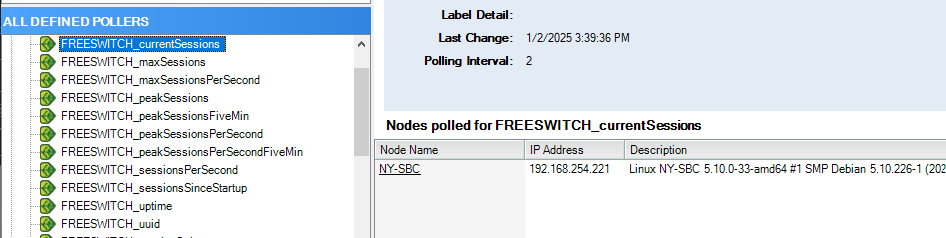
All of the stock FreeSWITCH metrics are being polled (scalars, via AgentX, but defined in UnDP).</p>

<p><img src="/assets/img/netsnmp-undp-startingpoint.png" alt="shell screenshot" /></p>

<p>
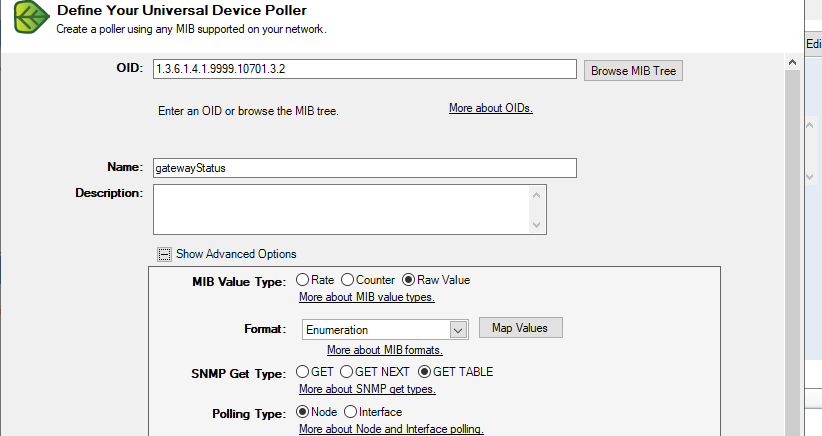
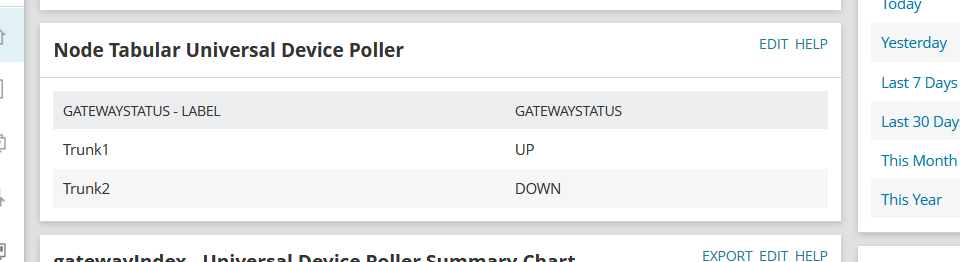
A sample of the tabular data imports via pass_persist, using column-at-once strategy (UnDP).</p>

<p><img src="/assets/img/netsnmp-undp-status-column.png" alt="shell screenshot" /></p>

<p>
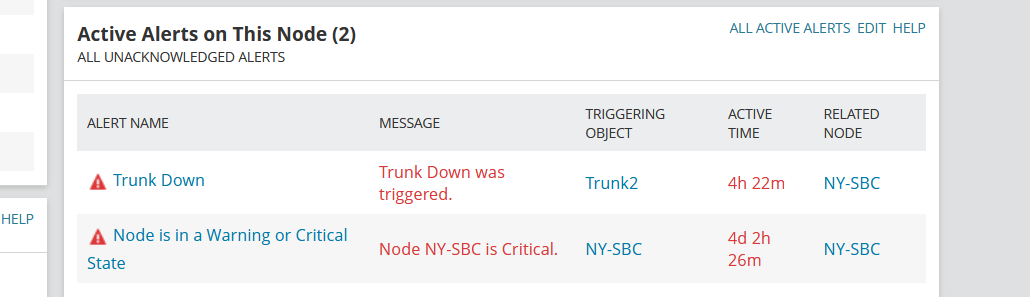
Status metric is successfully populating to SolarWinds UI as an actionable item, was able to define an alert around it.</p>

<p><img src="/assets/img/netsnmp-undp-trunk-down.png" alt="shell screenshot" /></p>

<p>Successfully triggered the alert on SIP Trunk Down.</p>

<p><img src="/assets/img/netsnmp-undp-trunk-alert.png" alt="shell screenshot" /></p>

<h2 id="final-chapter-consolidating-lessons-learned-and-delivering-a-robust-solution">Final Chapter: Consolidating Lessons Learned and Delivering a Robust Solution</h2>

<p>To complete the live custom metric implementation promised in the PoC, I needed to implement and plumb the actual live metric lookups from FreeSWITCH—swapping out the fake metrics for real ones.</p>

<p>I was thrilled with the simplicity of my prototype script, and that it actually worked. It was well-suited for the PoC, so I wanted to carry it forward as much as possible, in order to avoid introducing a lot of regressions.</p>

<p>How to tackle the redesign? I had the insight that the prototype back-end was implemented through the filesystem. I made a strategic decision to surgically modify the prototype script at the exact points where it interfaced with the filesystem, doing a 1:1 swap of the filesystem-targeting mechanism with a call-out to an external script that I would write to mimic the interface fully.</p>

<p>I identified three key mechanisms where my prototype pass_persist script was interacting with the filesystem: -z (does file exist) checks in conditional logic, ls -A (directory listing of OIDs), and cat (retrieval of values).</p>

<p>I also decided to do the refactor in two phases: in the first phase, I migrated the traversal/tree navigational aspects of the pass_persist script (e.g., does an OID exist, what is the “next” OID following this one) but left the actual metric retrieval logic targeting the dummy back-end. Once I had this aspect locked in and validated, I made a backup copy of my work and started on the live metric lookups as the final phase.</p>

<p>Here’s the final directory layout and the scripts in their complete form:</p>

<div class="language-plaintext highlighter-rouge"><div class="highlight"><pre class="highlight"><code>root@NY-SBC:/usr/local/scripts# pwd
/usr/local/scripts
root@NY-SBC:/usr/local/scripts# ls -la
total 28
drwxr-xr-x  2 root root 4096 Jan 13 01:48 .
drwxr-xr-x 11 root root 4096 Jan  5 18:26 ..
-rwxr-xr-x  1 root root 3095 Jan 13 01:48 get_value.sh
-rwxr-xr-x  1 root root  519 Jan 12 21:58 list_oids.sh
-rwxr-xr-x  1 root root  214 Jan 13 01:24 oid_exists.sh
-rwxr-xr-x  1 root root 4386 Jan 13 01:23 read_oid_persist.sh
root@NY-SBC:/usr/local/scripts#
</code></pre></div></div>

<h3 id="read_oid_persistsh-main-script"><strong>read_oid_persist.sh</strong> (main script)</h3>
<div class="language-bash highlighter-rouge"><div class="highlight"><pre class="highlight"><code><span class="c">#!/bin/bash</span>
<span class="nv">LOG_FILE</span><span class="o">=</span><span class="s2">"/tmp/read_oid_persist.log"</span>

<span class="nb">echo</span> <span class="s2">"</span><span class="si">$(</span><span class="nb">date</span><span class="si">)</span><span class="s2"> - Starting read_oid_persist.sh"</span> <span class="o">&gt;&gt;</span> <span class="s2">"</span><span class="nv">$LOG_FILE</span><span class="s2">"</span>

<span class="c"># Define external function interfaces</span>
oid_exists<span class="o">()</span> <span class="o">{</span>
    <span class="c"># Call an external script that checks if the OID exists</span>
    /usr/local/scripts/oid_exists.sh <span class="s2">"</span><span class="nv">$1</span><span class="s2">"</span>
<span class="o">}</span>

list_oids<span class="o">()</span> <span class="o">{</span>
    <span class="c"># Call an external script that lists OIDs in order</span>
    /usr/local/scripts/list_oids.sh
<span class="o">}</span>

get_value<span class="o">()</span> <span class="o">{</span>
    <span class="c"># Call an external script to get the value for the given OID</span>
    /usr/local/scripts/get_value.sh <span class="s2">"</span><span class="nv">$1</span><span class="s2">"</span>
<span class="o">}</span>

<span class="k">while </span><span class="nb">true</span><span class="p">;</span> <span class="k">do
    </span><span class="nb">read </span>CMD
    <span class="nb">echo</span> <span class="s2">"</span><span class="si">$(</span><span class="nb">date</span><span class="si">)</span><span class="s2"> - Command: </span><span class="nv">$CMD</span><span class="s2">"</span> <span class="o">&gt;&gt;</span> <span class="s2">"</span><span class="nv">$LOG_FILE</span><span class="s2">"</span>

    <span class="k">if</span> <span class="o">[</span> <span class="s2">"</span><span class="nv">$CMD</span><span class="s2">"</span> <span class="o">==</span> <span class="s2">"PING"</span> <span class="o">]</span><span class="p">;</span> <span class="k">then
        </span><span class="nb">echo</span> <span class="s2">"PONG"</span>
        <span class="nb">echo</span> <span class="s2">"</span><span class="si">$(</span><span class="nb">date</span><span class="si">)</span><span class="s2"> - Responding to PING with PONG"</span> <span class="o">&gt;&gt;</span> <span class="s2">"</span><span class="nv">$LOG_FILE</span><span class="s2">"</span>
    <span class="k">else
        </span><span class="nb">read </span>OID
        <span class="nb">echo</span> <span class="s2">"</span><span class="si">$(</span><span class="nb">date</span><span class="si">)</span><span class="s2"> - OID: </span><span class="nv">$OID</span><span class="s2">"</span> <span class="o">&gt;&gt;</span> <span class="s2">"</span><span class="nv">$LOG_FILE</span><span class="s2">"</span>

        <span class="k">if</span> <span class="o">[</span> <span class="s2">"</span><span class="nv">$CMD</span><span class="s2">"</span> <span class="o">==</span> <span class="s2">"get"</span> <span class="o">]</span><span class="p">;</span> <span class="k">then
            if </span>oid_exists <span class="s2">"</span><span class="nv">$OID</span><span class="s2">"</span><span class="p">;</span> <span class="k">then
                </span><span class="nv">VALUE</span><span class="o">=</span><span class="si">$(</span>get_value <span class="s2">"</span><span class="nv">$OID</span><span class="s2">"</span><span class="si">)</span>
                <span class="nv">TYPE</span><span class="o">=</span><span class="s2">"STRING"</span>
                <span class="k">if</span> <span class="o">[[</span> <span class="s2">"</span><span class="nv">$VALUE</span><span class="s2">"</span> <span class="o">=</span>~ ^[0-9][0-9]<span class="k">*</span><span class="nv">$ </span><span class="o">]]</span><span class="p">;</span> <span class="k">then
                    </span><span class="nv">TYPE</span><span class="o">=</span><span class="s2">"INTEGER"</span>
                <span class="k">fi
                </span><span class="nb">echo</span> <span class="s2">"</span><span class="nv">$OID</span><span class="s2">"</span>
                <span class="nb">echo</span> <span class="s2">"</span><span class="nv">$TYPE</span><span class="s2">"</span>
                <span class="nb">echo</span> <span class="s2">"</span><span class="nv">$VALUE</span><span class="s2">"</span>
                <span class="nb">echo</span> <span class="s2">"</span><span class="si">$(</span><span class="nb">date</span><span class="si">)</span><span class="s2"> - Returning value: </span><span class="nv">$VALUE</span><span class="s2"> for OID: </span><span class="nv">$OID</span><span class="s2">, Type: </span><span class="nv">$TYPE</span><span class="s2">"</span> <span class="o">&gt;&gt;</span> <span class="s2">"</span><span class="nv">$LOG_FILE</span><span class="s2">"</span>
            <span class="k">else
                </span><span class="nb">echo</span> <span class="s2">"NONE"</span>
                <span class="nb">echo</span> <span class="s2">"</span><span class="si">$(</span><span class="nb">date</span><span class="si">)</span><span class="s2"> - OID not found: </span><span class="nv">$OID</span><span class="s2">"</span> <span class="o">&gt;&gt;</span> <span class="s2">"</span><span class="nv">$LOG_FILE</span><span class="s2">"</span>
            <span class="k">fi
        elif</span> <span class="o">[</span> <span class="s2">"</span><span class="nv">$CMD</span><span class="s2">"</span> <span class="o">==</span> <span class="s2">"getnext"</span> <span class="o">]</span><span class="p">;</span> <span class="k">then
            </span><span class="nv">NEXT_OID</span><span class="o">=</span><span class="si">$(</span>list_oids | <span class="nb">grep</span> <span class="nt">-A</span> 1 <span class="s2">"^</span><span class="nv">$OID</span><span class="se">\$</span><span class="s2">"</span> | <span class="nb">tail</span> <span class="nt">-n</span> 1<span class="si">)</span>

            <span class="c"># Safety net: Check if NEXT_OID is the same as the original OID</span>
            <span class="k">if</span> <span class="o">[</span> <span class="s2">"</span><span class="nv">$NEXT_OID</span><span class="s2">"</span> <span class="o">==</span> <span class="s2">"</span><span class="nv">$OID</span><span class="s2">"</span> <span class="o">]</span> <span class="o">||</span> <span class="o">[</span> <span class="nt">-z</span> <span class="s2">"</span><span class="nv">$NEXT_OID</span><span class="s2">"</span> <span class="o">]</span><span class="p">;</span> <span class="k">then
                </span><span class="nv">NEXT_OID</span><span class="o">=</span><span class="s2">""</span>
            <span class="k">fi

            if </span>oid_exists <span class="s2">"</span><span class="nv">$NEXT_OID</span><span class="s2">"</span><span class="p">;</span> <span class="k">then
                </span><span class="nv">VALUE</span><span class="o">=</span><span class="si">$(</span>get_value <span class="s2">"</span><span class="nv">$NEXT_OID</span><span class="s2">"</span><span class="si">)</span>
                <span class="nv">TYPE</span><span class="o">=</span><span class="s2">"STRING"</span>
                <span class="k">if</span> <span class="o">[[</span> <span class="s2">"</span><span class="nv">$VALUE</span><span class="s2">"</span> <span class="o">=</span>~ ^[0-9][0-9]<span class="k">*</span><span class="nv">$ </span><span class="o">]]</span><span class="p">;</span> <span class="k">then
                    </span><span class="nv">TYPE</span><span class="o">=</span><span class="s2">"INTEGER"</span>
                <span class="k">fi
                </span><span class="nb">echo</span> <span class="s2">"</span><span class="nv">$NEXT_OID</span><span class="s2">"</span>
                <span class="nb">echo</span> <span class="s2">"</span><span class="nv">$TYPE</span><span class="s2">"</span>
                <span class="nb">echo</span> <span class="s2">"</span><span class="nv">$VALUE</span><span class="s2">"</span>
                <span class="nb">echo</span> <span class="s2">"</span><span class="si">$(</span><span class="nb">date</span><span class="si">)</span><span class="s2"> - Returning next OID: </span><span class="nv">$NEXT_OID</span><span class="s2"> with value: </span><span class="nv">$VALUE</span><span class="s2">, Type: </span><span class="nv">$TYPE</span><span class="s2">"</span> <span class="o">&gt;&gt;</span> <span class="s2">"</span><span class="nv">$LOG_FILE</span><span class="s2">"</span>
            <span class="k">else
                </span><span class="nb">echo</span> <span class="s2">"NONE"</span>
                <span class="nb">echo</span> <span class="s2">"</span><span class="si">$(</span><span class="nb">date</span><span class="si">)</span><span class="s2"> - Next OID not found after: </span><span class="nv">$OID</span><span class="s2">"</span> <span class="o">&gt;&gt;</span> <span class="s2">"</span><span class="nv">$LOG_FILE</span><span class="s2">"</span>
            <span class="k">fi
        elif</span> <span class="o">[</span> <span class="s2">"</span><span class="nv">$CMD</span><span class="s2">"</span> <span class="o">==</span> <span class="s2">"getbulk"</span> <span class="o">]</span><span class="p">;</span> <span class="k">then
            </span><span class="nb">read </span>NON_REPEATERS MAX_REPETITIONS
            <span class="nb">echo</span> <span class="s2">"</span><span class="si">$(</span><span class="nb">date</span><span class="si">)</span><span class="s2"> - Non-repeaters: </span><span class="nv">$NON_REPEATERS</span><span class="s2">, Max-repetitions: </span><span class="nv">$MAX_REPETITIONS</span><span class="s2">"</span> <span class="o">&gt;&gt;</span> <span class="s2">"</span><span class="nv">$LOG_FILE</span><span class="s2">"</span>

            <span class="nv">RESULTS</span><span class="o">=()</span>
            <span class="nv">CURRENT_OID</span><span class="o">=</span><span class="nv">$OID</span>

            <span class="k">for</span> <span class="o">((</span> <span class="nv">i</span><span class="o">=</span>0<span class="p">;</span> i&lt;<span class="nv">$NON_REPEATERS</span><span class="p">;</span> i++ <span class="o">))</span><span class="p">;</span> <span class="k">do
                if </span>oid_exists <span class="s2">"</span><span class="nv">$CURRENT_OID</span><span class="s2">"</span><span class="p">;</span> <span class="k">then
                    </span><span class="nv">VALUE</span><span class="o">=</span><span class="si">$(</span>get_value <span class="s2">"</span><span class="nv">$CURRENT_OID</span><span class="s2">"</span><span class="si">)</span>
                    <span class="nv">TYPE</span><span class="o">=</span><span class="s2">"STRING"</span>
                    <span class="k">if</span> <span class="o">[[</span> <span class="s2">"</span><span class="nv">$VALUE</span><span class="s2">"</span> <span class="o">=</span>~ ^[0-9][0-9]<span class="k">*</span><span class="nv">$ </span><span class="o">]]</span><span class="p">;</span> <span class="k">then
                        </span><span class="nv">TYPE</span><span class="o">=</span><span class="s2">"INTEGER"</span>
                    <span class="k">fi
                    </span>RESULTS+<span class="o">=(</span><span class="s2">"</span><span class="nv">$CURRENT_OID</span><span class="s2">"</span><span class="o">)</span>
                    RESULTS+<span class="o">=(</span><span class="s2">"</span><span class="nv">$TYPE</span><span class="s2">"</span><span class="o">)</span>
                    RESULTS+<span class="o">=(</span><span class="s2">"</span><span class="nv">$VALUE</span><span class="s2">"</span><span class="o">)</span>
                <span class="k">else
                    </span>RESULTS+<span class="o">=(</span><span class="s2">"NONE"</span><span class="o">)</span>
                <span class="k">fi
                </span><span class="nv">CURRENT_OID</span><span class="o">=</span><span class="si">$(</span>list_oids | <span class="nb">grep</span> <span class="nt">-A</span> 1 <span class="s2">"^</span><span class="nv">$CURRENT_OID</span><span class="se">\$</span><span class="s2">"</span> | <span class="nb">tail</span> <span class="nt">-n</span> 1<span class="si">)</span>

                <span class="c"># Safety net for non-repeaters</span>
                <span class="k">if</span> <span class="o">[</span> <span class="s2">"</span><span class="nv">$CURRENT_OID</span><span class="s2">"</span> <span class="o">==</span> <span class="s2">"</span><span class="nv">$OID</span><span class="s2">"</span> <span class="o">]</span> <span class="o">||</span> <span class="o">[</span> <span class="nt">-z</span> <span class="s2">"</span><span class="nv">$CURRENT_OID</span><span class="s2">"</span> <span class="o">]</span><span class="p">;</span> <span class="k">then
                    </span><span class="nv">CURRENT_OID</span><span class="o">=</span><span class="s2">""</span>
                <span class="k">fi
            done

            for</span> <span class="o">((</span> <span class="nv">i</span><span class="o">=</span>0<span class="p">;</span> i&lt;<span class="nv">$MAX_REPETITIONS</span><span class="p">;</span> i++ <span class="o">))</span><span class="p">;</span> <span class="k">do
                if </span>oid_exists <span class="s2">"</span><span class="nv">$CURRENT_OID</span><span class="s2">"</span><span class="p">;</span> <span class="k">then
                    </span><span class="nv">VALUE</span><span class="o">=</span><span class="si">$(</span>get_value <span class="s2">"</span><span class="nv">$CURRENT_OID</span><span class="s2">"</span><span class="si">)</span>
                    <span class="nv">TYPE</span><span class="o">=</span><span class="s2">"STRING"</span>
                    <span class="k">if</span> <span class="o">[[</span> <span class="s2">"</span><span class="nv">$VALUE</span><span class="s2">"</span> <span class="o">=</span>~ ^[0-9][0-9]<span class="k">*</span><span class="nv">$ </span><span class="o">]]</span><span class="p">;</span> <span class="k">then
                        </span><span class="nv">TYPE</span><span class="o">=</span><span class="s2">"INTEGER"</span>
                    <span class="k">fi
                    </span>RESULTS+<span class="o">=(</span><span class="s2">"</span><span class="nv">$CURRENT_OID</span><span class="s2">"</span><span class="o">)</span>
                    RESULTS+<span class="o">=(</span><span class="s2">"</span><span class="nv">$TYPE</span><span class="s2">"</span><span class="o">)</span>
                    RESULTS+<span class="o">=(</span><span class="s2">"</span><span class="nv">$VALUE</span><span class="s2">"</span><span class="o">)</span>
                <span class="k">else
                    </span>RESULTS+<span class="o">=(</span><span class="s2">"NONE"</span><span class="o">)</span>
                <span class="k">fi
                </span><span class="nv">CURRENT_OID</span><span class="o">=</span><span class="si">$(</span>list_oids | <span class="nb">grep</span> <span class="nt">-A</span> 1 <span class="s2">"^</span><span class="nv">$CURRENT_OID</span><span class="se">\$</span><span class="s2">"</span> | <span class="nb">tail</span> <span class="nt">-n</span> 1<span class="si">)</span>

                <span class="c"># Safety net for max repetitions</span>
                <span class="k">if</span> <span class="o">[</span> <span class="s2">"</span><span class="nv">$CURRENT_OID</span><span class="s2">"</span> <span class="o">==</span> <span class="s2">"</span><span class="nv">$OID</span><span class="s2">"</span> <span class="o">]</span> <span class="o">||</span> <span class="o">[</span> <span class="nt">-z</span> <span class="s2">"</span><span class="nv">$CURRENT_OID</span><span class="s2">"</span> <span class="o">]</span><span class="p">;</span> <span class="k">then
                    </span><span class="nv">CURRENT_OID</span><span class="o">=</span><span class="s2">""</span>
                <span class="k">fi
            done

            for </span>RESULT <span class="k">in</span> <span class="s2">"</span><span class="k">${</span><span class="nv">RESULTS</span><span class="p">[@]</span><span class="k">}</span><span class="s2">"</span><span class="p">;</span> <span class="k">do
                </span><span class="nb">echo</span> <span class="s2">"</span><span class="nv">$RESULT</span><span class="s2">"</span>
            <span class="k">done

            </span><span class="nb">echo</span> <span class="s2">"</span><span class="si">$(</span><span class="nb">date</span><span class="si">)</span><span class="s2"> - Returning bulk results for OID: </span><span class="nv">$OID</span><span class="s2">"</span> <span class="o">&gt;&gt;</span> <span class="s2">"</span><span class="nv">$LOG_FILE</span><span class="s2">"</span>
        <span class="k">else
            </span><span class="nb">echo</span> <span class="s2">"NONE"</span>
            <span class="nb">echo</span> <span class="s2">"</span><span class="si">$(</span><span class="nb">date</span><span class="si">)</span><span class="s2"> - Unknown command: </span><span class="nv">$CMD</span><span class="s2">"</span> <span class="o">&gt;&gt;</span> <span class="s2">"</span><span class="nv">$LOG_FILE</span><span class="s2">"</span>
        <span class="k">fi
    fi
done</span>
</code></pre></div></div>

<h3 id="list_oidssh-my-ls--a-drop-in-replacement"><strong>list_oids.sh</strong> (my ‘ls -A’ drop-in replacement)</h3>
<div class="language-bash highlighter-rouge"><div class="highlight"><pre class="highlight"><code><span class="c">#!/bin/bash</span>

<span class="c"># Replacement for "ls" command to mimic directory contents with correct order</span>

<span class="c"># Base OID</span>
<span class="nv">BASE_OID</span><span class="o">=</span><span class="s2">".1.3.6.1.4.1.9999.10701.1"</span>

<span class="c"># Get the number of gateways directly</span>
<span class="nv">NUM_GATEWAYS</span><span class="o">=</span><span class="si">$(</span><span class="nb">sudo</span> /usr/bin/fs_cli <span class="nt">-x</span> <span class="s1">'sofia status gateway'</span> | <span class="nb">grep </span>gateways: | <span class="nb">awk</span> <span class="s1">'{print $1}'</span><span class="si">)</span>

<span class="c"># Print OIDs in the required order</span>
<span class="nb">echo</span> <span class="s2">"</span><span class="nv">$BASE_OID</span><span class="s2">"</span>

<span class="c"># Loop through static entries and dynamic rows</span>
<span class="k">for</span> <span class="o">((</span><span class="nv">i</span><span class="o">=</span>1<span class="p">;</span> i&lt;<span class="o">=</span>4<span class="p">;</span> i++<span class="o">))</span><span class="p">;</span> <span class="k">do
    </span><span class="nb">echo</span> <span class="s2">"</span><span class="nv">$BASE_OID</span><span class="s2">.</span><span class="nv">$i</span><span class="s2">"</span>

    <span class="k">for</span> <span class="o">((</span><span class="nv">j</span><span class="o">=</span>1<span class="p">;</span> j&lt;<span class="o">=</span>NUM_GATEWAYS<span class="p">;</span> j++<span class="o">))</span><span class="p">;</span> <span class="k">do
        </span><span class="nb">echo</span> <span class="s2">"</span><span class="nv">$BASE_OID</span><span class="s2">.</span><span class="nv">$i</span><span class="s2">.</span><span class="nv">$j</span><span class="s2">"</span>
    <span class="k">done
done</span>
</code></pre></div></div>

<h3 id="oid_existssh-my--z-bash-if-file-exists-conditional-drop-in"><strong>oid_exists.sh</strong> (my “-z” bash if-file-exists conditional drop-in)</h3>

<div class="language-bash highlighter-rouge"><div class="highlight"><pre class="highlight"><code><span class="c">#!/bin/bash</span>

<span class="nv">OID</span><span class="o">=</span><span class="s2">"</span><span class="nv">$1</span><span class="s2">"</span>

<span class="c"># Check if OID exists by looking for it in the output of list_oids.sh</span>
<span class="k">if</span> /usr/local/scripts/list_oids.sh | <span class="nb">grep</span> <span class="nt">-q</span> <span class="s2">"^</span><span class="nv">$OID</span><span class="s2">$"</span><span class="p">;</span> <span class="k">then
    </span><span class="nb">exit </span>0  <span class="c"># OID found</span>
<span class="k">else
    </span><span class="nb">exit </span>1  <span class="c"># OID not found</span>
<span class="k">fi</span>
</code></pre></div></div>

<h3 id="get_valuesh-my-cat-drop-in-replacement"><strong>get_value.sh</strong> (my “cat” drop-in replacement)</h3>
<div class="language-bash highlighter-rouge"><div class="highlight"><pre class="highlight"><code><span class="c">#!/bin/bash</span>

<span class="c"># Ensure the OID is provided as an argument</span>
<span class="k">if</span> <span class="o">[</span> <span class="nt">-z</span> <span class="s2">"</span><span class="nv">$1</span><span class="s2">"</span> <span class="o">]</span><span class="p">;</span> <span class="k">then
  </span><span class="nb">echo</span> <span class="s2">"Usage: </span><span class="nv">$0</span><span class="s2"> &lt;OID&gt;"</span>
  <span class="nb">exit </span>1
<span class="k">fi</span>

<span class="c"># Define a function to retrieve the Nth gateway</span>
get_nth_gateway<span class="o">()</span> <span class="o">{</span>
  <span class="nb">local </span><span class="nv">N</span><span class="o">=</span><span class="nv">$1</span>
  <span class="nb">sudo </span>fs_cli <span class="nt">-x</span> <span class="s1">'sofia status gateway'</span> | <span class="nb">grep</span> <span class="s1">'@'</span> | <span class="nb">awk</span> <span class="s1">'{print $1}'</span> | <span class="nb">sed</span> <span class="nt">-n</span> <span class="s2">"</span><span class="k">${</span><span class="nv">N</span><span class="k">}</span><span class="s2">p"</span>
<span class="o">}</span>

<span class="c"># Unpack the OID to determine which gateway and which metric</span>
<span class="nv">OID</span><span class="o">=</span><span class="nv">$1</span>

<span class="c"># Example OID structure: .1.3.6.1.4.1.9999.10701.1.&lt;metric_type&gt;.&lt;gateway_index&gt;</span>
<span class="c"># Extract the metric type from the second-to-last part of the OID</span>
<span class="nv">METRIC_INDEX</span><span class="o">=</span><span class="si">$(</span><span class="nb">echo</span> <span class="s2">"</span><span class="nv">$OID</span><span class="s2">"</span> | <span class="nb">awk</span> <span class="nt">-F</span><span class="s1">'.'</span> <span class="s1">'{print $(NF-1)}'</span><span class="si">)</span>

<span class="c"># Extract the gateway index from the last part of the OID</span>
<span class="nv">GATEWAY_INDEX</span><span class="o">=</span><span class="si">$(</span><span class="nb">echo</span> <span class="s2">"</span><span class="nv">$OID</span><span class="s2">"</span> | <span class="nb">awk</span> <span class="nt">-F</span><span class="s1">'.'</span> <span class="s1">'{print $NF}'</span><span class="si">)</span>

<span class="c"># Define the anchor OIDs and their hard-coded return values</span>
<span class="nv">ANCHOR_OIDS</span><span class="o">=(</span>
    <span class="s2">".1.3.6.1.4.1.9999.10701.1"</span>
    <span class="s2">".1.3.6.1.4.1.9999.10701.1.1"</span>
    <span class="s2">".1.3.6.1.4.1.9999.10701.1.2"</span>
    <span class="s2">".1.3.6.1.4.1.9999.10701.1.3"</span>
    <span class="s2">".1.3.6.1.4.1.9999.10701.1.4"</span>
<span class="o">)</span>

<span class="c"># Define the corresponding hard-coded values for the anchor OIDs</span>
<span class="nv">ANCHOR_VALUES</span><span class="o">=(</span>
    <span class="s2">"gatewayTable"</span>
    <span class="s2">"gatewayIndex"</span>
    <span class="s2">"gatewayDescr"</span>
    <span class="s2">"gatewayStatus"</span>
    <span class="s2">"gatewayCalls"</span>
<span class="o">)</span>

<span class="c"># Check if the OID is one of the anchor OIDs</span>
<span class="k">for </span>i <span class="k">in</span> <span class="s2">"</span><span class="k">${</span><span class="p">!ANCHOR_OIDS[@]</span><span class="k">}</span><span class="s2">"</span><span class="p">;</span> <span class="k">do
    if</span> <span class="o">[</span> <span class="s2">"</span><span class="nv">$OID</span><span class="s2">"</span> <span class="o">==</span> <span class="s2">"</span><span class="k">${</span><span class="nv">ANCHOR_OIDS</span><span class="p">[</span><span class="nv">$i</span><span class="p">]</span><span class="k">}</span><span class="s2">"</span> <span class="o">]</span><span class="p">;</span> <span class="k">then</span>
        <span class="c"># Return the hard-coded value corresponding to the anchor OID</span>
        <span class="nb">echo</span> <span class="s2">"</span><span class="k">${</span><span class="nv">ANCHOR_VALUES</span><span class="p">[</span><span class="nv">$i</span><span class="p">]</span><span class="k">}</span><span class="s2">"</span>
        <span class="nb">exit </span>0
    <span class="k">fi
done</span>

<span class="c"># Get the gateway name using the embedded function</span>
<span class="nv">GATEWAY</span><span class="o">=</span><span class="si">$(</span>get_nth_gateway <span class="s2">"</span><span class="nv">$GATEWAY_INDEX</span><span class="s2">"</span><span class="si">)</span>

<span class="c"># Extract the specific metric for this gateway</span>
<span class="k">case</span> <span class="s2">"</span><span class="nv">$METRIC_INDEX</span><span class="s2">"</span> <span class="k">in</span>
    <span class="s2">"1"</span><span class="p">)</span>
        <span class="c"># gatewayIndex (just return the gateway index)</span>
        <span class="nv">METRIC_NAME</span><span class="o">=</span><span class="s2">"gatewayIndex"</span>
        <span class="nv">METRIC_VALUE</span><span class="o">=</span><span class="s2">"</span><span class="nv">$GATEWAY_INDEX</span><span class="s2">"</span>
        <span class="p">;;</span>
    <span class="s2">"2"</span><span class="p">)</span>
        <span class="c"># gatewayDescr (use the DESCR for the description)</span>
        <span class="nv">METRIC_NAME</span><span class="o">=</span><span class="s2">"gatewayDescr"</span>
        <span class="c"># Extract the description (the part after the "::")</span>
        <span class="nv">DESCR</span><span class="o">=</span><span class="si">$(</span><span class="nb">echo</span> <span class="s2">"</span><span class="nv">$GATEWAY</span><span class="s2">"</span> | <span class="nb">sed</span> <span class="s1">'s/.*:://'</span><span class="si">)</span>
        <span class="nv">METRIC_VALUE</span><span class="o">=</span><span class="s2">"</span><span class="nv">$DESCR</span><span class="s2">"</span>
        <span class="p">;;</span>
    <span class="s2">"3"</span><span class="p">)</span>
        <span class="c"># gatewayStatus (1=UP, 2=DOWN)</span>
        <span class="nv">METRIC_NAME</span><span class="o">=</span><span class="s2">"gatewayStatus"</span>
        <span class="nv">METRIC_VALUE</span><span class="o">=</span><span class="si">$(</span><span class="nb">sudo</span> /usr/bin/fs_cli <span class="nt">-x</span> <span class="s2">"sofia status gateway </span><span class="nv">$GATEWAY</span><span class="s2">"</span> | <span class="nb">awk</span> <span class="s1">'/^Status/ {print $2}'</span><span class="si">)</span>

        <span class="c"># Convert numeric status to string (1=UP, 2=DOWN), but return numeric value</span>
        <span class="k">if</span> <span class="o">[</span> <span class="s2">"</span><span class="nv">$METRIC_VALUE</span><span class="s2">"</span> <span class="o">==</span> <span class="s2">"UP"</span> <span class="o">]</span><span class="p">;</span> <span class="k">then
            </span><span class="nv">METRIC_VALUE</span><span class="o">=</span><span class="s2">"1"</span>
        <span class="k">elif</span> <span class="o">[</span> <span class="s2">"</span><span class="nv">$METRIC_VALUE</span><span class="s2">"</span> <span class="o">==</span> <span class="s2">"DOWN"</span> <span class="o">]</span><span class="p">;</span> <span class="k">then
            </span><span class="nv">METRIC_VALUE</span><span class="o">=</span><span class="s2">"2"</span>
        <span class="k">else
            </span><span class="nv">METRIC_VALUE</span><span class="o">=</span><span class="s2">"UNKNOWN"</span>  <span class="c"># Handle unexpected values</span>
        <span class="k">fi</span>
        <span class="p">;;</span>
    <span class="s2">"4"</span><span class="p">)</span>
        <span class="c"># gatewayCalls (fetching active calls from sofia status)</span>
        <span class="nv">METRIC_NAME</span><span class="o">=</span><span class="s2">"gatewayCalls"</span>
        <span class="c"># Extract the profile (the part before the "::")</span>
        <span class="nv">PROFILE</span><span class="o">=</span><span class="si">$(</span><span class="nb">echo</span> <span class="s2">"</span><span class="nv">$GATEWAY</span><span class="s2">"</span> | <span class="nb">sed</span> <span class="s1">'s/::.*//'</span><span class="si">)</span>
        <span class="nv">METRIC_VALUE</span><span class="o">=</span><span class="si">$(</span><span class="nb">sudo</span> /usr/bin/fs_cli <span class="nt">-x</span> <span class="s2">"sofia status"</span> | <span class="nb">awk</span> <span class="nt">-v</span> <span class="nv">profile</span><span class="o">=</span><span class="s2">"</span><span class="nv">$PROFILE</span><span class="s2">"</span> <span class="s1">'$1 == profile {gsub(/[()]/, "", $5); print $5}'</span><span class="si">)</span>

        <span class="c"># If we did not find a value, set it to 0 (or handle as needed)</span>
        <span class="k">if</span> <span class="o">[</span> <span class="nt">-z</span> <span class="s2">"</span><span class="nv">$METRIC_VALUE</span><span class="s2">"</span> <span class="o">]</span><span class="p">;</span> <span class="k">then
            </span><span class="nv">METRIC_VALUE</span><span class="o">=</span><span class="s2">"0"</span>
        <span class="k">fi</span>
        <span class="p">;;</span>
    <span class="k">*</span><span class="p">)</span>
        <span class="nb">echo</span> <span class="s2">"Unsupported metric type: </span><span class="nv">$METRIC_INDEX</span><span class="s2">"</span>
        <span class="nb">exit </span>2
        <span class="p">;;</span>
<span class="k">esac</span>

<span class="nb">echo</span> <span class="s2">"</span><span class="nv">$METRIC_VALUE</span><span class="s2">"</span>
</code></pre></div></div>

<h3 id="validation">Validation</h3>

<p>To ensure the robustness of the solution, I conducted extensive testing, covering a wide range of edge cases. The following examples are just a few key queries demonstrating that the solution is working as intended. This section reflects a fraction of the comprehensive validation efforts undertaken.</p>

<p>Idle system</p>

<div class="language-plaintext highlighter-rouge"><div class="highlight"><pre class="highlight"><code>root@NY-SBC:~# snmpwalk -v2c -c public localhost .1.3.6.1.4.1.9999.10701.1
SNMPv2-SMI::enterprises.9999.10701.1.1 = STRING: "gatewayIndex"
SNMPv2-SMI::enterprises.9999.10701.1.1.1 = INTEGER: 1
SNMPv2-SMI::enterprises.9999.10701.1.1.2 = INTEGER: 2
SNMPv2-SMI::enterprises.9999.10701.1.2 = STRING: "gatewayDescr"
SNMPv2-SMI::enterprises.9999.10701.1.2.1 = STRING: "chi-sbc"
SNMPv2-SMI::enterprises.9999.10701.1.2.2 = STRING: "la-sbc"
SNMPv2-SMI::enterprises.9999.10701.1.3 = STRING: "gatewayStatus"
SNMPv2-SMI::enterprises.9999.10701.1.3.1 = INTEGER: 1
SNMPv2-SMI::enterprises.9999.10701.1.3.2 = INTEGER: 1
SNMPv2-SMI::enterprises.9999.10701.1.4 = STRING: "gatewayCalls"
SNMPv2-SMI::enterprises.9999.10701.1.4.1 = INTEGER: 0
SNMPv2-SMI::enterprises.9999.10701.1.4.2 = INTEGER: 0
root@NY-SBC:~#
</code></pre></div></div>

<p>With a call placed on the trunk to chi-sbc</p>

<div class="language-plaintext highlighter-rouge"><div class="highlight"><pre class="highlight"><code>root@NY-SBC:~# snmpwalk -v2c -c public localhost .1.3.6.1.4.1.9999.10701.1
SNMPv2-SMI::enterprises.9999.10701.1.1 = STRING: "gatewayIndex"
SNMPv2-SMI::enterprises.9999.10701.1.1.1 = INTEGER: 1
SNMPv2-SMI::enterprises.9999.10701.1.1.2 = INTEGER: 2
SNMPv2-SMI::enterprises.9999.10701.1.2 = STRING: "gatewayDescr"
SNMPv2-SMI::enterprises.9999.10701.1.2.1 = STRING: "chi-sbc"
SNMPv2-SMI::enterprises.9999.10701.1.2.2 = STRING: "la-sbc"
SNMPv2-SMI::enterprises.9999.10701.1.3 = STRING: "gatewayStatus"
SNMPv2-SMI::enterprises.9999.10701.1.3.1 = INTEGER: 1
SNMPv2-SMI::enterprises.9999.10701.1.3.2 = INTEGER: 1
SNMPv2-SMI::enterprises.9999.10701.1.4 = STRING: "gatewayCalls"
SNMPv2-SMI::enterprises.9999.10701.1.4.1 = INTEGER: 1
SNMPv2-SMI::enterprises.9999.10701.1.4.2 = INTEGER: 0
</code></pre></div></div>

<p>With the SIP trunk NIC administratively forced to “DOWN” status on chi-sbc, after 30 seconds:</p>

<div class="language-plaintext highlighter-rouge"><div class="highlight"><pre class="highlight"><code>root@NY-SBC:~# snmpwalk -v2c -c public localhost .1.3.6.1.4.1.9999.10701.1
SNMPv2-SMI::enterprises.9999.10701.1.1 = STRING: "gatewayIndex"
SNMPv2-SMI::enterprises.9999.10701.1.1.1 = INTEGER: 1
SNMPv2-SMI::enterprises.9999.10701.1.1.2 = INTEGER: 2
SNMPv2-SMI::enterprises.9999.10701.1.2 = STRING: "gatewayDescr"
SNMPv2-SMI::enterprises.9999.10701.1.2.1 = STRING: "chi-sbc"
SNMPv2-SMI::enterprises.9999.10701.1.2.2 = STRING: "la-sbc"
SNMPv2-SMI::enterprises.9999.10701.1.3 = STRING: "gatewayStatus"
SNMPv2-SMI::enterprises.9999.10701.1.3.1 = INTEGER: 2
SNMPv2-SMI::enterprises.9999.10701.1.3.2 = INTEGER: 1
SNMPv2-SMI::enterprises.9999.10701.1.4 = STRING: "gatewayCalls"
SNMPv2-SMI::enterprises.9999.10701.1.4.1 = INTEGER: 1
SNMPv2-SMI::enterprises.9999.10701.1.4.2 = INTEGER: 0
root@NY-SBC:~#
root@NY-SBC:~#
</code></pre></div></div>

<p>After defining a third SIP Trunk targeting a new peer SBC “slc-sbc” (which is not online):</p>

<div class="language-plaintext highlighter-rouge"><div class="highlight"><pre class="highlight"><code>root@NY-SBC:~# snmpwalk -v2c -c public localhost .1.3.6.1.4.1.9999.10701.1
SNMPv2-SMI::enterprises.9999.10701.1.1 = STRING: "gatewayIndex"
SNMPv2-SMI::enterprises.9999.10701.1.1.1 = INTEGER: 1
SNMPv2-SMI::enterprises.9999.10701.1.1.2 = INTEGER: 2
SNMPv2-SMI::enterprises.9999.10701.1.1.3 = INTEGER: 3
SNMPv2-SMI::enterprises.9999.10701.1.2 = STRING: "gatewayDescr"
SNMPv2-SMI::enterprises.9999.10701.1.2.1 = STRING: "slc-sbc"
SNMPv2-SMI::enterprises.9999.10701.1.2.2 = STRING: "chi-sbc"
SNMPv2-SMI::enterprises.9999.10701.1.2.3 = STRING: "la-sbc"
SNMPv2-SMI::enterprises.9999.10701.1.3 = STRING: "gatewayStatus"
SNMPv2-SMI::enterprises.9999.10701.1.3.1 = INTEGER: 2
SNMPv2-SMI::enterprises.9999.10701.1.3.2 = INTEGER: 2
SNMPv2-SMI::enterprises.9999.10701.1.3.3 = INTEGER: 1
SNMPv2-SMI::enterprises.9999.10701.1.4 = STRING: "gatewayCalls"
SNMPv2-SMI::enterprises.9999.10701.1.4.1 = INTEGER: 0
SNMPv2-SMI::enterprises.9999.10701.1.4.2 = INTEGER: 0
SNMPv2-SMI::enterprises.9999.10701.1.4.3 = INTEGER: 0
root@NY-SBC:~#
</code></pre></div></div>

<p>After reverting the downed NIC back to “UP” state on chi-sbc:</p>

<div class="language-plaintext highlighter-rouge"><div class="highlight"><pre class="highlight"><code>root@NY-SBC:~# snmpwalk -v2c -c public localhost .1.3.6.1.4.1.9999.10701.1
SNMPv2-SMI::enterprises.9999.10701.1.1 = STRING: "gatewayIndex"
SNMPv2-SMI::enterprises.9999.10701.1.1.1 = INTEGER: 1
SNMPv2-SMI::enterprises.9999.10701.1.1.2 = INTEGER: 2
SNMPv2-SMI::enterprises.9999.10701.1.1.3 = INTEGER: 3
SNMPv2-SMI::enterprises.9999.10701.1.2 = STRING: "gatewayDescr"
SNMPv2-SMI::enterprises.9999.10701.1.2.1 = STRING: "slc-sbc"
SNMPv2-SMI::enterprises.9999.10701.1.2.2 = STRING: "chi-sbc"
SNMPv2-SMI::enterprises.9999.10701.1.2.3 = STRING: "la-sbc"
SNMPv2-SMI::enterprises.9999.10701.1.3 = STRING: "gatewayStatus"
SNMPv2-SMI::enterprises.9999.10701.1.3.1 = INTEGER: 2
SNMPv2-SMI::enterprises.9999.10701.1.3.2 = INTEGER: 1
SNMPv2-SMI::enterprises.9999.10701.1.3.3 = INTEGER: 1
SNMPv2-SMI::enterprises.9999.10701.1.4 = STRING: "gatewayCalls"
SNMPv2-SMI::enterprises.9999.10701.1.4.1 = INTEGER: 0
SNMPv2-SMI::enterprises.9999.10701.1.4.2 = INTEGER: 0
SNMPv2-SMI::enterprises.9999.10701.1.4.3 = INTEGER: 0
root@NY-SBC:~#
</code></pre></div></div>

<p>Test via the snmpbulkwalk utility to exercise GET BULK code path:</p>

<div class="language-plaintext highlighter-rouge"><div class="highlight"><pre class="highlight"><code>root@NY-SBC:~# snmpbulkwalk -v2c -c public localhost .1.3.6.1.4.1.9999.10701.1
SNMPv2-SMI::enterprises.9999.10701.1.1 = STRING: "gatewayIndex"
SNMPv2-SMI::enterprises.9999.10701.1.1.1 = INTEGER: 1
SNMPv2-SMI::enterprises.9999.10701.1.1.2 = INTEGER: 2
SNMPv2-SMI::enterprises.9999.10701.1.1.3 = INTEGER: 3
SNMPv2-SMI::enterprises.9999.10701.1.2 = STRING: "gatewayDescr"
SNMPv2-SMI::enterprises.9999.10701.1.2.1 = STRING: "slc-sbc"
SNMPv2-SMI::enterprises.9999.10701.1.2.2 = STRING: "chi-sbc"
SNMPv2-SMI::enterprises.9999.10701.1.2.3 = STRING: "la-sbc"
SNMPv2-SMI::enterprises.9999.10701.1.3 = STRING: "gatewayStatus"
SNMPv2-SMI::enterprises.9999.10701.1.3.1 = INTEGER: 2
SNMPv2-SMI::enterprises.9999.10701.1.3.2 = INTEGER: 1
SNMPv2-SMI::enterprises.9999.10701.1.3.3 = INTEGER: 1
SNMPv2-SMI::enterprises.9999.10701.1.4 = STRING: "gatewayCalls"
SNMPv2-SMI::enterprises.9999.10701.1.4.1 = INTEGER: 0
SNMPv2-SMI::enterprises.9999.10701.1.4.2 = INTEGER: 0
SNMPv2-SMI::enterprises.9999.10701.1.4.3 = INTEGER: 0
root@NY-SBC:~#
</code></pre></div></div>

<h2 id="closing-thoughts">Closing Thoughts</h2>

<p>This project demonstrates my ability to design and implement a custom SNMP monitoring solution for FreeSWITCH metrics, emphasizing a strategic and modular approach. From initial prototyping with dummy data to integrating live metrics, it showcases my dedication to building effective, real-world solutions.</p>

<p>The thorough testing and validation efforts reflect my focus on ensuring robustness and reliability. My determination and commitment to follow-through have been crucial in delivering this project.</p>

<p>I look forward to discussing the project further and appreciate the opportunity to demonstrate my approach to systems administration challenges with creativity and precision.</p>]]></content><author><name></name></author><summary type="html"><![CDATA[Background]]></summary></entry><entry><title type="html">Multi-City VoIP Network Implementation</title><link href="http://localhost:4000/2025/01/06/multicity-voip.html" rel="alternate" type="text/html" title="Multi-City VoIP Network Implementation" /><published>2025-01-06T03:00:00-05:00</published><updated>2025-01-06T03:00:00-05:00</updated><id>http://localhost:4000/2025/01/06/multicity-voip</id><content type="html" xml:base="http://localhost:4000/2025/01/06/multicity-voip.html"><![CDATA[<h2 id="background">Background</h2>
<p>In a previous project, I deployed a barebones PBX on Metaswitch Rhino TAS. While the Metaswitch platform itself was impressive, its bundled sample applications were rudimentary and intended only as source code examples. These sample applications lacked logs, metrics endpoints, and documentation. The key takeaway? Metaswitch Rhino TAS is a platform to build on, not anything flight-ready.</p>

<h2 id="overview">Overview</h2>

<p>Using FreeSWITCH and Asterisk—both well-regarded platforms—I’ve designed a multi-city VoIP network connecting New York, Los Angeles, and Chicago. Each site combines an Asterisk PBX for local functionality with a dedicated FreeSWITCH-based SBC to interconnect the sites over SIP trunks.</p>

<p>My intention is to mimic a real-world setup, emphasizing modularity and control over call flow using Back-to-Back User Agent (B2BUA) principles. Although this system operates in a closed environment without PSTN integration, the SBC lays a solid foundation for external connectivity if needed. This setup demonstrates industry-relevant skills in telephony, systems administration, and network design.</p>

<h2 id="focus">Focus</h2>

<p>This project isn’t about presenting a polished, Solutions Engineer-level blueprint, nor is it an attempt to teach industry professionals about their field. It’s about me devising and building an environment with enough complexity to showcase my hands-on approach to solving real-world systems administration challenges—and to prove that I’m someone you can trust to run your systems.</p>

<p>In my earlier project, I set up a barebones PBX on a single network segment—simple and straightforward. Now, I’m diving into something considerably more challenging. This project is designed to test and demonstrate my skills, showcasing my commitment to craft and determination to succeed.</p>

<h2 id="platform">Platform</h2>

<p>Commercial SBC solutions are designed for enterprise environments, focusing on reliability, performance, and predictable features. Open-source projects, on the other hand, often aim to cover diverse telephony use cases rather than specializing exclusively in SBC functionality.</p>

<p>In my search for an open-source SBC, I found projects with SBC capabilities that varied in focus and maturity. After careful consideration, I chose FreeSWITCH for its powerful feature set, active community, and robust developer support. It exceeded my requirements, offering a dependable and comprehensive solution without compromise.</p>

<p>For PBX functionality, Asterisk was the natural choice. Its proven reliability allowed me to separate PBX and SBC roles effectively, ensuring a straightforward and dependable solution for local telephony.</p>

<h2 id="layout">Layout</h2>

<h4 id="local-infrastructure">Local Infrastructure</h4>

<!-- Location Table -->
<table border="1">
  <thead>
    <tr>
      <th>Location</th>
      <th>Network</th>
      <th>SBC IP</th>
      <th>PBX IP</th>
    </tr>
  </thead>
  <tbody>
    <tr>
      <td>NY</td>
      <td>192.168.254.0/24</td>
      <td>192.168.254.221</td>
      <td>192.168.254.222</td>
    </tr>
    <tr>
      <td>CHI</td>
      <td>192.168.253.0/24</td>
      <td>192.168.253.221</td>
      <td>192.168.253.222</td>
    </tr>
    <tr>
      <td>LA</td>
      <td>192.168.252.0/24</td>
      <td>192.168.252.221</td>
      <td>192.168.252.222</td>
    </tr>
  </tbody>
</table>

<h4 id="dedicated-circuits">Dedicated Circuits</h4>
<!-- SIP Trunk Interconnections Table -->
<table border="1">
  <thead>
    <tr>
      <th>SIP Trunk</th>
      <th>Trunk ID</th>
      <th>Network</th>
      <th>NY-SBC IP</th>
      <th>LA-SBC IP</th>
      <th>CHI-SBC IP</th>
    </tr>
  </thead>
  <tbody>
    <tr>
      <td>NY ↔ LA</td>
      <td>Trunk 10</td>
      <td>10.10.10.0/30</td>
      <td>10.10.10.1</td>
      <td>10.10.10.2</td>
      <td></td>
    </tr>
    <tr>
      <td>NY ↔ CHI</td>
      <td>Trunk 20</td>
      <td>10.10.20.0/30</td>
      <td>10.10.20.1</td>
      <td></td>
      <td>10.10.20.2</td>
    </tr>
    <tr>
      <td>LA ↔ CHI</td>
      <td>Trunk 30</td>
      <td>10.10.30.0/30</td>
      <td></td>
      <td>10.10.30.1</td>
      <td>10.10.30.2</td>
    </tr>
  </tbody>
</table>
<ul>
  <li>In case of a SIP trunk failure, calls are automatically rerouted through the alternate city.</li>
</ul>

<h2 id="trunk-attachment">Trunk Attachment</h2>

<p>Determining whether to route the SIP trunks through the internal network via a firewall and NAT, or directly attach them to the SBC using a multi-homing strategy requires careful consideration of security, performance, network architecture, management complexity, and troubleshooting efficiency.</p>

<h3 id="the-standard-approach-routed-network-with-nat">The Standard Approach: Routed Network with NAT</h3>
<p>In the standard configuration, the SIP trunk is routed through the corporate network, typically via a firewall or router, with NAT applied. In this setup, the provider’s SIP traffic is directed to an external IP address on the firewall’s interface, which may be a private IP address if using a dedicated circuit (such as a point-to-point connection). The firewall then performs NAT to forward this traffic to the SBC’s internal IP address. Similarly, for outbound SIP traffic, the SBC uses the internal network to reach the provider, with the firewall translating the source IP to its external IP (again, typically a private IP in the case of a dedicated circuit), allowing the response to be correctly routed back.</p>

<p>This method is widely used because it acknowledges the firewall’s traditional role in perimeter security, effectively isolating the SBC from direct exposure to the external SIP trunk network. It also simplifies management by leveraging existing network infrastructure and firewall policies already in place for other services. The primary benefit is that the firewall handles both inbound and outbound traffic, ensuring security, address translation, and routing. The SBC does not need to sit on multiple networks and communicates to and from its peers via a single IP address.</p>

<p>However, deployment and troubleshooting can be delayed when different teams need to coordinate, especially when vendor support is required.</p>

<h3 id="the-multi-homing-approach-direct-attachment-to-the-sbc">The Multi-Homing Approach: Direct Attachment to the SBC</h3>
<p>Alternatively, the multi-homing strategy involves directly attaching the SIP trunk to the SBC, effectively treating the SBC as the gateway to the external network. This approach consolidates control within the SBC, positioning it as the central component for all SIP traffic, with fewer dependencies on external routers or firewalls for SIP management.</p>

<p>The appeal of multi-homing lies in the potential for simplified operations. By routing SIP traffic directly through the SBC, you centralize control, ensuring all troubleshooting and management can be done from a single system. This eliminates the need to coordinate with other network devices and reduces the complexity of dealing with multiple points of failure. Moreover, because the SBC handles the routing internally, it can provide a more streamlined and direct path for SIP communication, enhancing performance by reducing intermediary network hops.</p>

<p>However, this approach is not without its complexities. The SBC now takes on responsibilities traditionally handled by routers and firewalls. While this offers full control, it also increases the configuration complexity, requiring deeper engagement with FreeSWITCH to ensure proper setup. Additionally, this approach demands a higher level of attention to the SBC’s security and performance, as it becomes directly connected to the external network.</p>

<h3 id="decision-streamlined-operations-through-multi-homing">Decision: Streamlined Operations through Multi-Homing</h3>

<p>While the multi-homing strategy requires more effort initially, it ultimately streamlines operations, providing a more efficient operation. This approach simplifies management by consolidating control into the SBC, where all key configurations can be handled from a single point.</p>

<p>With this setup, only one skill—managing the SBC—needs to be mastered. There’s no need to hand off tasks between teams or bounce between the SBC, firewall, router, and other devices. Deployments, moves, adds, and changes can be done directly within the SBC, eliminating delays and inefficiencies associated with multiple handoffs. Troubleshooting is also simplified, as issues can be diagnosed and resolved from a single system, reducing complexity and speeding up resolution times by minimizing the need for cross-team coordination.</p>

<p>Key considerations for adopting the multi-homing strategy include:</p>

<ol>
  <li><strong>Consolidated Operations</strong>:
    <ul>
      <li>Centralized control within the SBC.</li>
      <li>Streamlined management and troubleshooting into a single system.</li>
      <li>Simplified deployments, moves, adds, and changes within the SBC, reducing delays and inefficiencies.</li>
    </ul>
  </li>
  <li><strong>Coordination Delays</strong>:
    <ul>
      <li>Eliminated the need for handoffs between different teams or devices, minimizing potential deployment and troubleshooting delays.</li>
      <li>Reduced complexity by having a single point of control and responsibility.</li>
    </ul>
  </li>
  <li><strong>Finger-Pointing</strong>:
    <ul>
      <li>Reduced the likelihood of finger-pointing and evasive responses during troubleshooting.</li>
      <li>Simplified issue resolution with a clear, single point of focus, speeding up response times and minimizing miscommunication.</li>
    </ul>
  </li>
</ol>

<p>In summary, while the multi-homing strategy requires more effort initially, it brings significant long-term benefits by consolidating operations, minimizing coordination delays, and reducing the potential for finger-pointing. This results in a more efficient and streamlined operation, providing a cohesive VoIP infrastructure with minimal external dependencies.</p>

<h2 id="network-bindings">Network bindings</h2>

<div class="language-plaintext highlighter-rouge"><div class="highlight"><pre class="highlight"><code>root@NY-SBC:~# ip addr
1: lo: &lt;LOOPBACK,UP,LOWER_UP&gt; mtu 65536 qdisc noqueue state UNKNOWN group default qlen 1000
    link/loopback 00:00:00:00:00:00 brd 00:00:00:00:00:00
    inet 127.0.0.1/8 scope host lo
       valid_lft forever preferred_lft forever
    inet6 ::1/128 scope host
       valid_lft forever preferred_lft forever
2: ens18: &lt;BROADCAST,MULTICAST,UP,LOWER_UP&gt; mtu 1500 qdisc pfifo_fast state UP group default qlen 1000
    link/ether bc:24:11:e6:67:38 brd ff:ff:ff:ff:ff:ff
    altname enp0s18
    inet 192.168.254.221/24 brd 192.168.254.255 scope global ens18
       valid_lft forever preferred_lft forever
    inet6 fe80::be24:11ff:fee6:6738/64 scope link
       valid_lft forever preferred_lft forever
3: ens19: &lt;BROADCAST,MULTICAST,UP,LOWER_UP&gt; mtu 1500 qdisc pfifo_fast state UP group default qlen 1000
    link/ether bc:24:11:03:1f:36 brd ff:ff:ff:ff:ff:ff
    altname enp0s19
    inet 10.10.10.1/30 brd 10.10.10.3 scope global ens19
       valid_lft forever preferred_lft forever
    inet6 fe80::be24:11ff:fe03:1f36/64 scope link
       valid_lft forever preferred_lft forever
4: ens20: &lt;BROADCAST,MULTICAST,UP,LOWER_UP&gt; mtu 1500 qdisc pfifo_fast state UP group default qlen 1000
    link/ether bc:24:11:42:e4:ad brd ff:ff:ff:ff:ff:ff
    altname enp0s20
    inet 10.10.20.1/30 brd 10.10.20.3 scope global ens20
       valid_lft forever preferred_lft forever
    inet6 fe80::be24:11ff:fe42:e4ad/64 scope link
       valid_lft forever preferred_lft forever
root@NY-SBC:~#
</code></pre></div></div>

<h3 id="sip-profiles">SIP Profiles</h3>

<div class="language-plaintext highlighter-rouge"><div class="highlight"><pre class="highlight"><code>freeswitch@NY-SBC&gt; sofia status
                     Name          Type                                       Data      State
=================================================================================================
            external-ipv6       profile                   sip:mod_sofia@[::1]:5080      RUNNING (0)
                  trunk20       profile              sip:mod_sofia@10.10.20.1:5060      RUNNING (0)
         trunk20::chi-sbc       gateway                      sip:ny-sbc@10.10.20.2      REGED
                 external       profile           sip:mod_sofia@50.48.215.192:5080      RUNNING (0)
    external::example.com       gateway                    sip:joeuser@example.com      NOREG
       lab4.decoursey.com         alias                                    trunk10      ALIASED
            internal-ipv6       profile                   sip:mod_sofia@[::1]:5060      RUNNING (0)
                  trunk10       profile              sip:mod_sofia@10.10.10.1:5060      RUNNING (0)
          trunk10::la-sbc       gateway                      sip:ny-sbc@10.10.10.2      REGED
                 internal       profile         sip:mod_sofia@192.168.254.221:5060      RUNNING (0)
=================================================================================================
6 profiles 1 alias

freeswitch@NY-SBC&gt;
</code></pre></div></div>

<h2 id="freeswitch-multi-homed-configuration">FreeSWITCH Multi-Homed Configuration</h2>

<p>My initial approach to FreeSWITCH’s multi-homed setup involved configuring the NICs for the internal and SIP trunk networks, and then modifying the default FreeSWITCH configuration to define the required endpoints and parameters. However, this strategy didn’t work as expected.</p>

<p>There are several places in the default configuration where items like source IP and signaling IP addresses are hand-configured. In a multi-homed scenario, what’s correct in one context can be wrong in another. Therefore, simply editing the default configuration files (SIP profiles) isn’t sufficient.</p>

<p>The breakthrough came in defining distinct SIP profiles for each network segment and ensuring that remote gateways are affiliated with the correct network they are reachable through.</p>

<h3 id="sip-profiles-1">SIP Profiles</h3>

<p>In FreeSWITCH, SIP profiles define how FreeSWITCH communicates with devices on specific network segments. A SIP profile is tied to a network interface (or IP address) and dictates how SIP traffic is handled on that segment. For example:</p>

<ol>
  <li><strong>Internal Profile:</strong> Handles communication with internal devices or PBXs, usually bound to a private IP address on the local network.</li>
  <li><strong>SIP Trunk Profiles:</strong> Each SIP trunk network requires its own unique SIP profile, which directly binds to the IP assigned to that SIP trunk network. This profile is aligned with the network facing the specific SIP trunk and ensures that the traffic is routed correctly.</li>
</ol>

<h3 id="gateway-definitions">Gateway Definitions</h3>

<p><strong>Gateway Definitions</strong> in FreeSWITCH specify how the system connects to other SIP endpoints, such as remote PBXs, other SBCs, or SIP providers. Each gateway needs to be associated with a SIP profile, and this relationship ensures traffic is routed through the correct network interface. For example, a gateway might be defined to point to a remote SBC, specifying the SBC’s IP address or hostname, the necessary authentication credentials, and the associated SIP profile.</p>

<h3 id="the-key-relationship-sip-profiles-and-gateways">The Key Relationship: SIP Profiles and Gateways</h3>

<p>The most important aspect of working with multiple network segments in FreeSWITCH is the relationship between SIP profiles and Gateway Definitions. Each gateway must be associated with the appropriate SIP profile that defines the network interface it should use. This is crucial because SIP traffic must be routed through the correct network interface—whether it’s the internal network or a dedicated SIP trunk network.</p>

<p>If you’re connecting to a remote SIP trunk over a secondary NIC, you would:</p>
<ul>
  <li>Create a SIP Trunk Profile bound to the IP of the secondary NIC.</li>
  <li>Define a gateway within that profile, pointing to the remote endpoint (e.g., the remote SBC or SIP provider).</li>
  <li>Ensure the gateway’s definition matches the SIP Trunk Profile’s network interface to correctly route the traffic.</li>
</ul>

<h3 id="conclusion">Conclusion</h3>

<p>In a multi-homed environment, especially when facing both internal and SIP trunk networks, FreeSWITCH must be explicitly configured to handle each network segment. This involves creating a unique SIP profile for each network interface and ensuring that each Gateway Definition points to the appropriate profile.</p>

<h2 id="dialplan">Dialplan</h2>

<p>The FreeSWITCH dialplans are organized around where the traffic is presenting from.</p>

<h3 id="inbound-arrivals">Inbound arrivals</h3>

<p>The below NY-SBC configuration is for handling calls arriving via Trunk 10, the circuit from LA. In general, it’s expected this should be calls destined for our NY-PBX extensions, and the plan is to hand these to NY-PBX. However, these might also be CHI-PBX destined calls that were failed over, and in that eventuality, we route those calls to CHI-SBC.</p>

<div class="language-plaintext highlighter-rouge"><div class="highlight"><pre class="highlight"><code>root@NY-SBC:/etc/freeswitch/dialplan# cat trunk10.xml
&lt;include&gt;
  &lt;context name="trunk10"&gt;

    &lt;!-- Safeguard against SIP loops --&gt;
    &lt;extension name="unloop"&gt;
      &lt;condition field="${unroll_loops}" expression="^true$"/&gt;
      &lt;condition field="${sip_looped_call}" expression="^true$"&gt;
        &lt;action application="deflect" data="${destination_number}"/&gt;
      &lt;/condition&gt;
    &lt;/extension&gt;

    &lt;!-- Route calls to the PBX --&gt;
    &lt;extension name="route-to-pbx"&gt;
      &lt;condition field="destination_number" expression="^254\d{2}$"&gt;
        &lt;action application="bridge" data="sofia/internal/${destination_number}@192.168.254.222"/&gt;
      &lt;/condition&gt;
    &lt;/extension&gt;

    &lt;!-- Failover routing in case of primary trunk failure. --&gt;
    &lt;extension name="route-to-chi"&gt;
      &lt;condition field="destination_number" expression="^(253\d{2})$"&gt;
        &lt;action application="bridge" data="sofia/gateway/chi-sbc/$1"/&gt;
      &lt;/condition&gt;
    &lt;/extension&gt;

    &lt;!-- Handle unmatched calls gracefully --&gt;
    &lt;extension name="unmatched-calls"&gt;
      &lt;condition field="destination_number" expression=".*"&gt;
        &lt;action application="hangup" data="UNALLOCATED_NUMBER"/&gt;
      &lt;/condition&gt;
    &lt;/extension&gt;

  &lt;/context&gt;
&lt;/include&gt;
root@NY-SBC:/etc/freeswitch/dialplan#
</code></pre></div></div>

<h3 id="outbound-dials">Outbound dials</h3>

<p>For outbound dials I ended up calling out to a Lua script.</p>

<div class="language-plaintext highlighter-rouge"><div class="highlight"><pre class="highlight"><code>root@NY-SBC:/etc/freeswitch/dialplan# cat public/01_route_to_la.xml
&lt;extension name="route-to-la"&gt;
    &lt;condition field="destination_number" expression="^252[0-9][0-9]$"&gt;
        &lt;action application="lua" data="route_to_la.lua"/&gt;
    &lt;/condition&gt;
&lt;/extension&gt;

root@NY-SBC:/etc/freeswitch/dialplan#
</code></pre></div></div>

<p>This is that script.</p>

<div class="language-plaintext highlighter-rouge"><div class="highlight"><pre class="highlight"><code>root@NY-SBC:/etc/freeswitch/dialplan# cat /usr/share/freeswitch/scripts/route_to_la.lua
-- Initialize the FreeSWITCH API object
local api = freeswitch.API()

-- Function to check gateway status
local function check_gateway_status(gateway_name)
    local status = api:execute("sofia", "status gateway " .. gateway_name)
    if string.match(status, "Status%s+UP") then
        return "UP"
    else
        return "DOWN"
    end
end

-- Retrieve the destination number from the session
local destination_number = session:getVariable("destination_number")

if not destination_number then
    freeswitch.consoleLog("ERROR", "Destination number is nil. Unable to proceed.\n")
    session:hangup("NORMAL_TEMPORARY_FAILURE")
    return
end

-- Define the primary and secondary gateways
local primary_gateway = { name = "la-sbc", dialstring = "sofia/gateway/la-sbc/" .. destination_number }
local secondary_gateway = { name = "chi-sbc", dialstring = "sofia/gateway/chi-sbc/" .. destination_number }

-- Check the status of the primary gateway
local primary_status = check_gateway_status(primary_gateway.name)
freeswitch.consoleLog("INFO", "Primary gateway '" .. primary_gateway.name .. "' status: " .. primary_status .. "\n")

if primary_status == "UP" then
    -- Route the call through the primary gateway
    freeswitch.consoleLog("INFO", "Routing through primary gateway: " .. primary_gateway.name .. "\n")
    session:execute("bridge", primary_gateway.dialstring)
else
    -- If primary is down, check the secondary gateway
    local secondary_status = check_gateway_status(secondary_gateway.name)
    freeswitch.consoleLog("INFO", "Secondary gateway '" .. secondary_gateway.name .. "' status: " .. secondary_status .. "\n")

    if secondary_status == "UP" then
        -- Route the call through the secondary gateway
        freeswitch.consoleLog("INFO", "Routing through secondary gateway: " .. secondary_gateway.name .. "\n")
        session:execute("bridge", secondary_gateway.dialstring)
    else
        -- Neither gateway is up; try the primary and be done with it
        freeswitch.consoleLog("WARNING", "Both gateways are down. Attempting primary as a last resort.\n")
        session:execute("bridge", primary_gateway.dialstring)
    end
end

-- If no gateways succeed, hang up
if session:getVariable("originate_disposition") ~= "SUCCESS" then
    freeswitch.consoleLog("ERROR", "All attempts failed. Hanging up.\n")
    session:hangup("NORMAL_TEMPORARY_FAILURE")
end
root@NY-SBC:/etc/freeswitch/dialplan#
</code></pre></div></div>

<h2 id="failover-to-backup-sip-trunks">Failover to Backup SIP Trunks</h2>

<p>During the PoC, automatic backup failover was right at my fingertips when setting up the SIP trunks, so it got pulled in. While it was an easy win, any push to production will start with a discussion of likely failure points, and the actual first-pass redundancy design may focus elsewhere.</p>

<p>Each SBC is responsible for routing calls to a remote city via its SIP trunk. However, if the trunk is down, should we route the call through another city?</p>

<p>The challenge here is that we can’t know for certain whether this secondary routing will help. It ultimately depends on the root cause of the problem—whether it’s a network issue affecting the entire site or just a specific SIP trunk that’s down.</p>

<h3 id="guiding-principles-and-analysis">Guiding Principles and Analysis</h3>

<p>Failover engineering has some guiding principles, with one of the most important being caution around blindly failing over to another site. That other site may not be in any better posture to handle the traffic, and routing requests without understanding the underlying issue can lead to further complications. The nuances and gotchas in failover design are varied, but the general takeaway is to approach such decisions thoughtfully and with an understanding of potential risks.</p>

<p>After analysis, SIP’s end-to-end setup design offers an advantage in this case. If the call can’t be completed all the way to the callee, regardless of how many hops are involved, the failure will propagate all the way back to the original bridging attempt. It’s not as if the call would be accepted at an intermediary site, only to be mishandled there.</p>

<h3 id="freeswitch-failover-implementation">FreeSWITCH Failover Implementation</h3>

<p>FreeSWITCH’s documentation provides a straightforward approach for failover, using the | separator to attempt a call on a secondary trunk if the primary one fails:</p>

<div class="language-xml highlighter-rouge"><div class="highlight"><pre class="highlight"><code><span class="nt">&lt;action</span> <span class="na">application=</span><span class="s">"bridge"</span> <span class="na">data=</span><span class="s">"sofia/gateway/primary/dialstring|sofia/gateway/secondary/dialstring"</span><span class="nt">/&gt;</span>
</code></pre></div></div>

<p>During testing, this mechanism works well when the primary trunk is down. However, if the primary trunk is active and the callee rejects the call, FreeSWITCH’s failover mechanism attempts to bridge the call again, causing an unwanted re-ring for the party who just rejected it. I tried using scripting constructs to address this by evaluating the failure reason, but faced a race condition where I couldn’t get the failure reason in time to make an informed decision. While I haven’t ruled out a workable solution with developers or configuration experts, I have shifted focus for now.</p>

<h3 id="monitoring-and-fail-open-strategy">Monitoring and Fail-Open Strategy</h3>

<p>I was committed to implementing some form of failover, even if not perfect. Fortunately, my systems constantly monitor trunk status via SIP OPTIONS—I have the pings configured to occur every 15 seconds, providing real-time status feedback. Using this data, I can check via API call whether a trunk is up or down before attempting to route the call through it and then prioritize relay attempts likely to succeed. I even have some logic to try to “fail open” in the event of a status lookup failure, in which case the call is attempted down the primary route.</p>

<h3 id="conclusion-effective-failover-mechanism">Conclusion: Effective Failover Mechanism</h3>

<p>While this approach isn’t perfect, it’s reliable in all scenarios I’ve tested and provides an effective failover mechanism that avoids unnecessary retries or misrouting. This solution ensures that calls are handled efficiently, even in the event of a trunk outage, without introducing any significant delays or side effects.</p>

<h2 id="solarwinds-integration-progress-update">SolarWinds Integration Progress Update</h2>

<p>The integration of SNMP monitoring into the SBCs is an ongoing effort, and significant progress has been made. While this feature isn’t yet complete, the groundwork laid so far demonstrates a clear path forward. Here’s what has been accomplished:</p>

<h3 id="net-snmp-integration"><strong>Net-SNMP Integration</strong></h3>
<ul>
  <li>Successfully installed and configured the Linux Net-SNMP daemon on the SBCs.</li>
  <li>Integrated FreeSWITCH’s built-in metrics using the AgentX protocol, enabling initial SNMP data collection.</li>
</ul>

<h3 id="solarwinds-universal-device-pollers-undp"><strong>SolarWinds Universal Device Pollers (UnDP)</strong></h3>
<ul>
  <li>Verified integration of FreeSWITCH metrics into SolarWinds through the Universal Device Poller feature.</li>
  <li>Ensured stock metrics are now visible and trackable within the SolarWinds dashboard.</li>
</ul>

<h3 id="dynamic-sip-trunk-discovery"><strong>Dynamic SIP Trunk Discovery</strong></h3>
<ul>
  <li>Designed a strategy to dynamically discover SIP trunks defined on an SBC using table-based SNMP lookups.</li>
  <li>This approach automates the addition of SIP trunk data into SolarWinds, eliminating the need for manual definitions.</li>
</ul>

<h3 id="command-line-and-shell-scripting"><strong>Command Line and Shell Scripting</strong></h3>
<ul>
  <li>Extensively utilized the fs_cli command-line interface for FreeSWITCH to explore available metrics.</li>
  <li>Developed and tested shell scripts using Net-SNMP’s “extend” and “pass” mechanisms to integrate these metrics into SolarWinds.</li>
</ul>

<p>This progress marks a strong foundation for a fully functional monitoring solution. The project remains active, and I anticipate delivering a further update by this Friday. The next steps include finalizing the dynamic discovery mechanism and refining the data presentation in SolarWinds.</p>

<h2 id="freeswitch-logging">FreeSWITCH Logging</h2>

<p>As a systems administrator, understanding and managing FreeSWITCH logging is crucial for maintaining system health and troubleshooting issues efficiently. This guide aims to provide a detailed overview of FreeSWITCH logging, including log file locations, rotation policies, retention periods, log details, and verbosity adjustments.</p>

<h3 id="out-of-the-box-logging">Out-of-the-Box Logging</h3>

<p>FreeSWITCH logs a variety of information by default, including system events, errors, and call handling details. The primary log file is <code class="language-plaintext highlighter-rouge">/var/log/freeswitch/freeswitch.log</code>.</p>

<h3 id="configuring-log-storage-rotation-retention-and-verbosity">Configuring Log Storage, Rotation, Retention, and Verbosity</h3>

<p>Log storage location, rotation, retention, and verbosity are all configured within the <code class="language-plaintext highlighter-rouge">/etc/freeswitch/autoload_configs/logfile.conf.xml</code> file. Here’s how you can adjust these settings to meet your needs:</p>

<div class="language-xml highlighter-rouge"><div class="highlight"><pre class="highlight"><code><span class="nt">&lt;configuration</span> <span class="na">name=</span><span class="s">"logfile.conf.xml"</span><span class="nt">&gt;</span>
  <span class="nt">&lt;settings&gt;</span>
    <span class="c">&lt;!-- Log file location --&gt;</span>
    <span class="nt">&lt;param</span> <span class="na">name=</span><span class="s">"logfile"</span> <span class="na">value=</span><span class="s">"/var/log/freeswitch/freeswitch.log"</span><span class="nt">/&gt;</span>

    <span class="c">&lt;!-- Log rotation settings --&gt;</span>
    <span class="nt">&lt;param</span> <span class="na">name=</span><span class="s">"logrotate-size"</span> <span class="na">value=</span><span class="s">"104857600"</span><span class="nt">/&gt;</span> <span class="c">&lt;!-- Default: 100MB --&gt;</span>
    <span class="nt">&lt;param</span> <span class="na">name=</span><span class="s">"logrotate-count"</span> <span class="na">value=</span><span class="s">"10"</span><span class="nt">/&gt;</span> <span class="c">&lt;!-- Default: 10 files --&gt;</span>

    <span class="c">&lt;!-- Log verbosity level --&gt;</span>
    <span class="nt">&lt;param</span> <span class="na">name=</span><span class="s">"loglevel"</span> <span class="na">value=</span><span class="s">"INFO"</span><span class="nt">/&gt;</span> <span class="c">&lt;!-- Default: INFO --&gt;</span>
  <span class="nt">&lt;/settings&gt;</span>
  <span class="nt">&lt;mappings&gt;</span>
    <span class="c">&lt;!-- Default log level: info. Remove the comment from the next line to switch to debug --&gt;</span>
    <span class="nt">&lt;map</span> <span class="na">name=</span><span class="s">"all"</span> <span class="na">value=</span><span class="s">"console,info,notice,warning,err,crit,alert"</span><span class="nt">/&gt;</span>
    <span class="c">&lt;!-- Uncomment the following line if you want debug-level logging --&gt;</span>
    <span class="c">&lt;!-- &lt;map name="all" value="console,debug,info,notice,warning,err,crit,alert"/&gt; --&gt;</span>
  <span class="nt">&lt;/mappings&gt;</span>
  <span class="c">&lt;!-- Prefix all log lines by the session's uuid  --&gt;</span>
  <span class="nt">&lt;param</span> <span class="na">name=</span><span class="s">"uuid"</span> <span class="na">value=</span><span class="s">"true"</span> <span class="nt">/&gt;</span>
<span class="nt">&lt;/configuration&gt;</span>
</code></pre></div></div>

<p><strong>Rotation and Retention</strong>: Adjust the configuration settings to meet your retention requirements. For example, you might increase the file size limit or the number of retained logs if necessary.</p>

<p><strong>Verbosity</strong>: The default log verbosity in FreeSWITCH was observed to be <code class="language-plaintext highlighter-rouge">DEBUG</code>, which may be excessive for regular operation. For my deployment, I have dialed this back to <code class="language-plaintext highlighter-rouge">INFO</code>, which provides information suitable for normal operation. Higher verbosity levels, such as <code class="language-plaintext highlighter-rouge">DEBUG</code>, are generally used when actively troubleshooting detailed issues. Adjust the verbosity level to your preference.</p>

<h3 id="log-details-for-call-handling">Log Details for Call Handling</h3>

<p>The <code class="language-plaintext highlighter-rouge">freeswitch.log</code> file contains detailed information about call handling, including timestamps, log levels, source file names, line numbers, function names, and log data. Here is an example of a sample log line:</p>

<div class="language-plaintext highlighter-rouge"><div class="highlight"><pre class="highlight"><code>12812bf9-98c8-4307-8fca-ca542bad93e6 2025-01-05 04:02:32.021541 99.33% [NOTICE] switch_channel.c:1142 New Channel sofia/internal/25301@192.168.253.222 [12812bf9-98c8-4307-8fca-ca542bad93e6]
12812bf9-98c8-4307-8fca-ca542bad93e6 2025-01-05 04:02:32.021541 99.33% [INFO] sofia.c:10460 sofia/internal/25301@192.168.253.222 receiving invite from 192.168.253.222:5060 version: 1.10.12 -release-10222002881-a88d069d6fgit a88d069 2024-08-02 21:02:27Z 64bit call-id: f5ec2cfe-6b6c-43b3-b162-f22216eb5219
12812bf9-98c8-4307-8fca-ca542bad93e6 2025-01-05 04:02:32.041536 99.33% [INFO] sofia.c:10460 sofia/internal/25301@192.168.253.222 receiving invite from 192.168.253.222:5060 version: 1.10.12 -release-10222002881-a88d069d6fgit a88d069 2024-08-02 21:02:27Z 64bit call-id: f5ec2cfe-6b6c-43b3-b162-f22216eb5219
12812bf9-98c8-4307-8fca-ca542bad93e6 2025-01-05 04:02:32.041536 99.33% [INFO] mod_dialplan_xml.c:639 Processing 25301 &lt;25301&gt;-&gt;25401 in context public
12812bf9-98c8-4307-8fca-ca542bad93e6 EXECUTE [depth=0] sofia/internal/25301@192.168.253.222 set(outside_call=true)
12812bf9-98c8-4307-8fca-ca542bad93e6 EXECUTE [depth=0] sofia/internal/25301@192.168.253.222 export(RFC2822_DATE=Sun, 05 Jan 2025 04:02:32 -0500)
12812bf9-98c8-4307-8fca-ca542bad93e6 EXECUTE [depth=0] sofia/internal/25301@192.168.253.222 lua(route_to_ny.lua)
2025-01-05 04:02:32.041536 99.33% [INFO] switch_cpp.cpp:1466 Primary gateway 'ny-sbc' status: UP
2025-01-05 04:02:32.041536 99.33% [INFO] switch_cpp.cpp:1466 Routing through primary gateway: ny-sbc
12812bf9-98c8-4307-8fca-ca542bad93e6 EXECUTE [depth=0] sofia/internal/25301@192.168.253.222 bridge(sofia/gateway/ny-sbc/25401)
91777dc4-8d81-492b-bae1-af495eea7a97 2025-01-05 04:02:32.041536 99.33% [NOTICE] switch_channel.c:1142 New Channel sofia/trunk20/25401 [91777dc4-8d81-492b-bae1-af495eea7a97]
91777dc4-8d81-492b-bae1-af495eea7a97 2025-01-05 04:02:32.041536 99.33% [INFO] sofia_glue.c:1659 sofia/trunk20/25401 sending invite call-id: (null)
2025-01-05 04:02:32.641541 99.33% [INFO] sofia.c:1348 sofia/trunk20/25401 Update Callee ID to "Outbound Call" &lt;sip:25401@10.10.20.1&gt;
91777dc4-8d81-492b-bae1-af495eea7a97 2025-01-05 04:02:32.641541 99.33% [NOTICE] sofia.c:7604 Ring-Ready sofia/trunk20/25401!
12812bf9-98c8-4307-8fca-ca542bad93e6 2025-01-05 04:02:32.641541 99.33% [NOTICE] mod_sofia.c:2514 Ring-Ready sofia/internal/25301@192.168.253.222!
12812bf9-98c8-4307-8fca-ca542bad93e6 2025-01-05 04:02:32.641541 99.33% [NOTICE] switch_ivr_originate.c:572 Ring Ready sofia/internal/25301@192.168.253.222!
2025-01-05 04:02:41.441459 99.23% [INFO] sofia.c:1348 sofia/trunk20/25401 Update Callee ID to "Outbound Call" &lt;sip:25401@10.10.20.1&gt;
91777dc4-8d81-492b-bae1-af495eea7a97 2025-01-05 04:02:41.441459 99.23% [NOTICE] sofia.c:8681 Channel [sofia/trunk20/25401] has been answered
12812bf9-98c8-4307-8fca-ca542bad93e6 2025-01-05 04:02:41.461440 99.23% [NOTICE] sofia_media.c:90 Pre-Answer sofia/internal/25301@192.168.253.222!
12812bf9-98c8-4307-8fca-ca542bad93e6 2025-01-05 04:02:41.461440 99.23% [NOTICE] switch_ivr_originate.c:3855 Channel [sofia/internal/25301@192.168.253.222] has been answered
</code></pre></div></div>

<h3 id="remote-syslog">Remote Syslog</h3>

<p>FreeSWITCH supports remote syslog logging through the <code class="language-plaintext highlighter-rouge">mod_syslog</code> module. This feature allows you to send log messages to a remote syslog server, which is useful for centralized logging and monitoring.</p>

<ol>
  <li>Load the <code class="language-plaintext highlighter-rouge">mod_syslog</code> Module:
If the <code class="language-plaintext highlighter-rouge">mod_syslog</code> module is not already loaded, you need to load it by adding it to the FreeSWITCH modules configuration file. Open the <code class="language-plaintext highlighter-rouge">/etc/freeswitch/autoload_configs/modules.conf.xml</code> file and add the following line:
    <div class="language-xml highlighter-rouge"><div class="highlight"><pre class="highlight"><code><span class="nt">&lt;load</span> <span class="na">module=</span><span class="s">"mod_syslog"</span><span class="nt">/&gt;</span>
</code></pre></div>    </div>
  </li>
  <li>
    <p>Edit <code class="language-plaintext highlighter-rouge">/etc/freeswitch/autoload_configs/switch.conf.xml</code>:</p>

    <p>Add the remote syslog configuration:</p>

    <div class="language-xml highlighter-rouge"><div class="highlight"><pre class="highlight"><code><span class="nt">&lt;extension</span> <span class="na">name=</span><span class="s">"remote_syslog"</span> <span class="na">priority=</span><span class="s">"1"</span><span class="nt">&gt;</span>
  <span class="nt">&lt;action</span> <span class="na">application=</span><span class="s">"log"</span> <span class="na">loglevel=</span><span class="s">"debug"</span><span class="nt">/&gt;</span>
  <span class="nt">&lt;action</span> <span class="na">application=</span><span class="s">"syslog"</span> <span class="na">loglevel=</span><span class="s">"debug"</span> <span class="na">server=</span><span class="s">"syslog.example.com"</span> <span class="na">port=</span><span class="s">"514"</span><span class="nt">/&gt;</span>
<span class="nt">&lt;/extension&gt;</span>
</code></pre></div>    </div>
  </li>
</ol>

<p>It looks to be possible to condition the send based on call criteria if desired via advanced configuration syntax.</p>

<h3 id="quick-tips-and-tricks">Quick Tips and Tricks</h3>

<ul>
  <li>
    <p><strong>Grep by UUID</strong>: Use <code class="language-plaintext highlighter-rouge">grep &lt;uuid&gt; /var/log/freeswitch/freeswitch.log</code> to filter log entries by the session’s UUID. This is useful for isolating log details related to a specific call session, even with interleaved calls.</p>
  </li>
  <li>
    <p><strong>Grep by Value then UUID</strong>: First, grep for a specific value, such as a phone number, to identify the UUID of a call attempt. For example: <code class="language-plaintext highlighter-rouge">grep "25301" /var/log/freeswitch/freeswitch.log</code>. Then, use the UUID to grep for all related log entries: <code class="language-plaintext highlighter-rouge">grep &lt;uuid&gt; /var/log/freeswitch/freeswitch.log</code>.</p>
  </li>
  <li>
    <p><strong>Tail the Log File</strong>: Use <code class="language-plaintext highlighter-rouge">tail -f /var/log/freeswitch/freeswitch.log</code> to continuously monitor the log file in real-time. This is helpful for observing live events and troubleshooting as they happen.</p>
  </li>
  <li>
    <p><strong>Count Errors</strong>: Use <code class="language-plaintext highlighter-rouge">grep -c ERROR /var/log/freeswitch/freeswitch.log.*</code> to count the number of error entries in the log files. This can give you a quick overview of the system’s health and highlight recurring issues.</p>
  </li>
</ul>

<h3 id="final-thoughts-on-logging">Final Thoughts on Logging</h3>

<p>Effective logging practices are essential for proactive system administration. Here are some final tips to help you get the most out of FreeSWITCH logging:</p>

<ol>
  <li><strong>Practice Pulling Log Details</strong>:
    <ul>
      <li>Regularly pull log details for test calls and interpret the entries, even if there are no issues. This practice helps develop muscle memory around log file locations and interpretation, ensuring the skills are readily available when needed urgently.</li>
    </ul>
  </li>
  <li><strong>Routinely Examine Log Files</strong>:
    <ul>
      <li>Examine log files regularly for benign or unnoticed errors. Try to clean up these errors if possible. If not, be aware of exactly what these benign errors are, so they do not become misleading distractions during emergency troubleshooting.</li>
    </ul>
  </li>
  <li><strong>Keep Debug Logging in Mind</strong>:
    <ul>
      <li>Always consider enabling debug logging if the standard logs are not providing enough information. Attempt to replicate the issue or request a fresh example to be performed while debug logging is enabled. This approach can provide deeper insights and help pinpoint the problem.</li>
    </ul>
  </li>
</ol>

<p>By incorporating these practices into your regular system maintenance routine, you can ensure that you are well-prepared to handle any issues that arise and maintain a healthy, well-functioning system.</p>

<h2 id="using-fs_cli-for-troubleshooting-freeswitch">Using <code class="language-plaintext highlighter-rouge">fs_cli</code> for Troubleshooting FreeSWITCH</h2>

<p>When troubleshooting FreeSWITCH, <strong><code class="language-plaintext highlighter-rouge">fs_cli</code></strong> is your go-to tool for real-time management and debugging. It connects directly to the core FreeSWITCH process and provides a fast, interactive way to manage logs, monitor SIP traffic, and check profile status.</p>

<h3 id="getting-started">Getting Started</h3>

<p>To connect interactively:</p>

<div class="language-plaintext highlighter-rouge"><div class="highlight"><pre class="highlight"><code>fs_cli  
</code></pre></div></div>

<p>For one-off commands (good for bash scripting):</p>

<div class="language-plaintext highlighter-rouge"><div class="highlight"><pre class="highlight"><code>fs_cli -x "command"  
</code></pre></div></div>

<h3 id="adjusting-logs">Adjusting Logs</h3>

<p>Set the logging level to debug for detailed troubleshooting:</p>

<div class="language-plaintext highlighter-rouge"><div class="highlight"><pre class="highlight"><code>log level debug  
</code></pre></div></div>

<p>Note: Log verbosity changes here are not persistent.</p>

<p>Reduce verbosity when done:</p>

<div class="language-plaintext highlighter-rouge"><div class="highlight"><pre class="highlight"><code>log level info  
</code></pre></div></div>

<h3 id="sip-tracing">SIP Tracing</h3>
<p>Enable SIP signaling traces for live traffic monitoring:</p>

<div class="language-plaintext highlighter-rouge"><div class="highlight"><pre class="highlight"><code>sofia global siptrace on  
</code></pre></div></div>

<p>Disable it once you’re finished:</p>

<div class="language-plaintext highlighter-rouge"><div class="highlight"><pre class="highlight"><code>sofia global siptrace off  
</code></pre></div></div>

<h3 id="checking-profile-status">Checking Profile Status</h3>

<p>View an overview of all SIP profiles:</p>

<div class="language-plaintext highlighter-rouge"><div class="highlight"><pre class="highlight"><code>sofia status  
</code></pre></div></div>

<p>Dive into the details of a specific profile:</p>

<div class="language-plaintext highlighter-rouge"><div class="highlight"><pre class="highlight"><code>sofia status profile &lt;profile_name&gt;  
</code></pre></div></div>

<h3 id="beyond-the-essentials">Beyond the Essentials</h3>

<p><code class="language-plaintext highlighter-rouge">fs_cli</code> is packed with commands for deeper troubleshooting:</p>
<ul>
  <li>Show active calls and channels</li>
  <li>List registered endpoints</li>
  <li>Inspect call variables by UUID</li>
</ul>

<p>Stick with logs, traces, and profiles for most scenarios, but know the tool can handle much more when needed.</p>

<h2 id="closing-thoughts">Closing Thoughts</h2>

<p>This project highlights my ability to build a practical, multi-city VoIP network that balances complexity with real-world relevance. From SIP profile design to failover logic, it demonstrates a hands-on approach to solving problems and creating systems that work.</p>

<p>While the monitoring component and full validation details aren’t finished, the foundation is solid, and progress is on track for an update by Friday. This reflects my focus on delivering meaningful results rather than rushing to check boxes.</p>

<p>I look forward to discussing the project further and appreciate the opportunity to showcase how I approach systems administration challenges with thoughtfulness and follow-through.</p>]]></content><author><name></name></author><summary type="html"><![CDATA[Background In a previous project, I deployed a barebones PBX on Metaswitch Rhino TAS. While the Metaswitch platform itself was impressive, its bundled sample applications were rudimentary and intended only as source code examples. These sample applications lacked logs, metrics endpoints, and documentation. The key takeaway? Metaswitch Rhino TAS is a platform to build on, not anything flight-ready.]]></summary></entry><entry><title type="html">Excellence in Mid-Market UCaaS Delivery</title><link href="http://localhost:4000/2024/12/22/metaswitch-rhino-sdk.html" rel="alternate" type="text/html" title="Excellence in Mid-Market UCaaS Delivery" /><published>2024-12-22T03:00:00-05:00</published><updated>2024-12-22T03:00:00-05:00</updated><id>http://localhost:4000/2024/12/22/metaswitch-rhino-sdk</id><content type="html" xml:base="http://localhost:4000/2024/12/22/metaswitch-rhino-sdk.html"><![CDATA[<h3 id="overview">Overview</h3>

<p>The evolution of unified communications (UC) has presented significant opportunities and challenges for mid-market operators. As technologies like Microsoft Teams disrupt traditional models, operators must adapt to remain competitive. Metaswitch, with its Rhino Telephone Application Server (TAS), offers a platform for telephony software development that enables differentiation in the marketplace. By exploring its deployment, this project aims to demonstrate the potential for mid-market operators to leverage this tool in addressing evolving customer needs.</p>

<p>This technical exploration not only evaluates the Rhino TAS SDK as a platform but also showcases the critical role systems administration plays in deploying and managing customer-facing services effectively.</p>

<h3 id="background">Background</h3>

<p>The telecom industry has long been on a journey to modernize its infrastructure. The shift from aging circuit-switched systems to flexible, packet-switched networks has facilitated the retirement of legacy hardware, with software-based platforms taking over the functions of physical switches. Technologies like VoIP, Voice over LTE (VoLTE), and the IP Multimedia Subsystem (IMS) have been at the heart of these efforts, enabling greater efficiency and scalability.</p>

<p>Throughout this transformation, the importance of maintaining the reliability of traditional telephony was clear. Telephones continue to be indispensable, trusted devices that people rely on, particularly in emergencies, with an expectation that they will simply work without fail. Therefore, while the telecom landscape was modernizing, the industry needed to ensure that this shift did not compromise the bulletproof reliability of dial tone services.</p>

<p>To meet these challenges, Metaswitch’s Rhino Telephone Application Server (TAS) has become a widely adopted platform for both mobile and traditional carriers. Its design prioritizes stability while supporting a broad range of modern protocols, empowering carriers to deliver reliable, high-quality voice and multimedia services over advanced IP networks.</p>

<p>While Rhino TAS is predominantly known for its role in carrier infrastructure, its architecture and capabilities make it highly adaptable for other sectors, including mid-market UCaaS operators. This makes it an ideal platform for those operators seeking to differentiate themselves in the increasingly competitive space. Rhino TAS offers the flexibility and power to support complex, customized telephony services, such as advanced routing, logic, and integrations—capabilities that are key for mid-market operators looking to offer more than just basic PSTN integration services.</p>

<p>Microsoft Teams software addresses many communication needs, but it leaves opportunities for enhancement—both in terms of services and product functionality—that operators can fill. Operators, particularly those with a long-standing presence in the telecom industry—firms that developed robust cloud PBX and CCaaS offerings before Microsoft Teams reshaped the market—are well-positioned to continue creating advanced software for telephony systems. These operators are not newcomers merely meeting the minimum certification requirements for Operator Connect; they bring a deep history of telecom expertise and a proven track record of excellence.</p>

<p>The UCaaS market is rapidly expanding. While Teams is the centerpiece of this transformation, the true value for mid-market UCaaS operators lies in their ability to deliver value-added services that Microsoft doesn’t directly provide. As channel partners of Microsoft, operators play a critical role in offering services such as PSTN integration, legacy system migration, and ongoing support, helping businesses transition smoothly to modern communication solutions.</p>

<h3 id="opportunities-left-for-mid-market-operators">Opportunities Left for Mid-Market Operators</h3>

<p>Big telecom carriers and tech giants often overlook opportunities in the mid-market UCaaS space. Mid-market customers require the same high-touch, detailed migration and integration work as enterprise customers, yet they don’t offer the same large-scale revenue potential that drives the focus of bigger players.</p>

<p>This is where mid-market operators come in. They deliver tailored solutions that address the needs of peer-sized businesses—needs that larger providers are unwilling to fulfill. This creates a distinct niche in the UCaaS market, where success hinges not only on the ability to integrate the right partnerships, technologies, and operational expertise, but also on delivering comprehensive service. The best operators distinguish themselves through superior service delivery—advising, implementing, and supporting their customers in ways the tech giants can’t match.</p>

<h3 id="differentiation-within-the-mid-market-segment">Differentiation within the Mid-Market Segment</h3>

<p>While exceptional service delivery is key to success within the UCaaS mid-market, strategic platform selection plays a role in helping operators enhance that service. While all mid-market operators aim to fill gaps left by larger players, it is the most successful operators who make deliberate platform choices to differentiate themselves. The choice of platform directly influences an operator’s ability to deliver value, foster innovation, and meet the specific needs of their customers.</p>

<p>Broadly speaking, operators can select from three distinct classes of solutions. The first category consists of barebones, “SBC-only” systems, designed to meet the minimum requirements for market entry with minimal investment. The second category adds configurable PBX software alongside the SBC. These platforms offer significant flexibility but are limited by the inherent constraints of off-the-shelf software. The third category encompasses fully custom solutions built on highly adaptable platforms, where the SBC remains foundational, but off-the-shelf PBX software is replaced with custom software development.</p>

<p>To illustrate the range of approaches available to mid-market operators, consider men’s suiting:</p>

<ul>
  <li><strong>Off-the-shelf suits</strong>: aligns with basic SBCs and call routing—adequate for meeting minimum qualifications like those required for Operator Connect but offering no meaningful technical differentiation.</li>
  <li><strong>Made-to-measure suits</strong>: represents the integration of commercially available, configurable PBX software—offering a better fit for customer needs, but still constrained by predefined templates.</li>
  <li><strong>Fully bespoke suits</strong>: corresponds to custom-developed software on platforms like Metaswitch Rhino TAS. This approach enables operators to break free from predefined limits and craft solutions uniquely tailored to their customers.</li>
</ul>

<h3 id="build-rather-than-buy-market-leadership-through-custom-solutions">Build Rather Than Buy: Market Leadership through Custom Solutions</h3>

<p>Operators have a unique opportunity to establish market leadership by positioning themselves as software developers. By doing so, they can move beyond the limitations of off-the-shelf solutions and create offerings that are uniquely suited to their customers’ needs.</p>

<p><strong>Step One</strong>: Clearly articulate the gaps left by Teams and design a product to sit ahead of Teams in the call flow. This product should implement the exact features needed to fill those gaps. Think of this as your base product—sleek, purpose-built, and foundational to your service offering.</p>

<p><strong>Step Two</strong>: During the sales phase, identify customer needs and customization opportunities, documenting these requirements in the contract or SOW. In the onboarding phase, these requirements are implemented through a focused development sprint, creating custom middleware that integrates with customer end systems, along with other code enhancements. This approach ensures each deployment is tailored precisely to the customer’s needs.</p>

<p>By choosing Metaswitch Rhino TAS, operators can:</p>

<ul>
  <li><strong>Address Gaps Left by Teams</strong>: Deliver tailored solutions that broadly enhance and complement Microsoft Teams’ functionality, ensuring they meet the wider market needs.</li>
  <li><strong>Tackle Specific Customer Requirements</strong>: Provide custom solutions that precisely address the unique and individual demands of each customer.</li>
  <li><strong>Enable Future Vision</strong>: Empower product management to roadmap and develop new features, never worrying about off-the-shelf PBX software limitations.</li>
  <li><strong>Adapt Quickly</strong>: Address specific customer needs on your timeline, not an upstream vendor’s.</li>
  <li><strong>Deepen Customer Relationships</strong>: Offer tailored solutions that position the operator as a long-term partner, not just a service provider.</li>
</ul>

<h3 id="calling-your-own-number-a-solution-architecture-proposal">Calling Your Own Number: A Solution Architecture Proposal</h3>

<p>Enhanced call handling begins by placing yourself into the call flow. While SBCs typically route calls based on static identifiers like Dialed Number Identification Service (DNIS), a more agile approach moves the routing configurtion entirely out of the SBC. Instead, this logic resides in a dedicated call-handling application—perhaps called the Routing Manager—a small but powerful system running alongside the SBC.</p>

<p>The SBC is not instructed about the call’s final destination; instead, its configuration hands every incoming call to the Routing Manager. This step represents a key transition in the call flow, providing an opportunity to establish control and implement solutions that address gaps left by downstream systems like Teams or accommodate customer-specific requirements.</p>

<p>The Routing Manager can perform real-time lookups using external systems, such as CRMs or customer databases, whether on-premises or in the cloud, to inform its routing decision. Once the decision is made, the Routing Manager forwards the call to its final destination—such as Teams or another endpoint—via SIP REFER.</p>

<p>For example, imagine a call arriving for a customer with specific routing rules. The Routing Manager could:</p>

<ul>
  <li>Query a CRM or third-party API for live data.</li>
  <li>Dynamically adjust routing based on the caller’s history, preferences, or current status.</li>
  <li>Apply advanced logic tailored to compliance, business workflows, or other requirements.</li>
</ul>

<h3 id="reality-check-stability-as-the-cornerstone-of-success">Reality Check: Stability as the Cornerstone of Success</h3>

<p>While differentiation through advanced features is a compelling sales story, it’s important to recognize that many customers do not have unique technical requirements. For these customers, the decision to partner with a UCaaS provider often hinges on factors like reputation, references, alignment in company size, and the appeal of consolidating telecom needs with a single, trusted partner. This approach provides one point of accountability, eliminates the risk of finger-pointing between vendors, and ensures access to a knowledgeable advisor who understands the market landscape and product offerings.</p>

<p>Retention is driven by stable, dependable service and consistent execution in key areas like billing accuracy, responsive and effective support, efficient move-add-change, and account management. While issues are inevitable, how they are handled can make all the difference. When challenges arise, prompt and transparent resolution not only helps maintain trust but can strengthen the customer relationship by demonstrating a commitment to their success and minimizing disruption. Stability remains the top priority, as technical issues or service interruptions can quickly undermine trust and jeopardize the relationship.</p>

<p>As Microsoft Teams with Calling Plans continues to address its limitations, mid-market operators face growing competition from both big tech giants and peer competitors. In this competitive landscape, technical execution is mandatory—and the role of systems administrators in ensuring solid execution cannot be overstated. At renewal time, the goal is for technical execution and NOC support to be viewed as an asset to retention, rather than an obstacle.</p>

<h3 id="managing-service-quality-and-reliability-in-ucaas-operations">Managing Service Quality and Reliability in UCaaS Operations</h3>

<p>Successfully delivering PSTN-integrated UCaaS solutions requires not just robust infrastructure, but also the ability to manage complex relationships and responsibilities across multiple service layers.</p>

<p>Operators manage the call flow from the PSTN, often bundling the telecom carrier into the opportunity. This dual role means operators not only maintain their own SBCs, which sit within the call flow, but also rely on third-party carriers, who are equally vulnerable to outages.</p>

<p>Ultimately, the operator bears responsibility for the service’s overall quality. Any service disruption—whether from the operator’s internal systems or from the third-party telecom carrier—can damage the operator’s reputation: customers see the operator as the single point of contact and accountability.</p>

<p>Outages at the carrier level often provide no visibility to the operator. The first—and sometimes only—indication of an issue may be zero call volume, a metric that can be hard to interpret accurately. Is it a carrier outage, or just a lull? Without proactive visibility into carrier systems, operators must either rely on basic monitoring methods (where zero call volume triggers alerts), which means dealing with false positives, or wait for customer complaints.</p>

<p>In UCaaS environments, balancing call flow resilience with reliable Internet access is crucial. While voice paths can remain functional during an outage, relying on a single carrier for Internet access can disrupt real-time app integrations, like customer data lookups, affecting the user experience. Using blended Internet connections with multiple carriers ensures both call flow and application performance remain stable, even during carrier-specific disruptions. This approach is vital for maintaining service quality and avoiding performance degradation in real-time integrations.</p>

<h3 id="the-role-of-expert-systems-administrators-in-ucaas">The Role of Expert Systems Administrators in UCaaS</h3>

<p>Flawless execution across all operational areas is critical, but systems administrators play an especially vital role in maintaining the infrastructure that powers essential services like call handling, routing, monitoring, and failover mechanisms. This role requires a deep understanding of the systems at play and a proactive approach to ensuring reliability.</p>

<p>Effective monitoring begins with an intimate understanding of your infrastructure stack. This includes knowing the processes (e.g., Jetty, Apache, MySQL) that should be running, their expected quantities, and their roles. It also involves identifying health check and status-oriented URLs. Health check URLs provide basic up/down status, while status-oriented endpoints often expose metrics that can be scraped for deeper insights.</p>

<p>Metrics form the backbone of two critical monitoring tools: alerts and dashboards. Alerts are your early warning system, auto-detecting problems and triggering alarms. They rely entirely on the metrics you’ve collected, so unearthing the right data points is essential. Dashboards, on the other hand, are your daily touchpoint with the system. Regularly reviewing these graphs helps you internalize what “normal” looks like, making it easier to spot anomalies at a glance. This combination of proactive alerts and intuitive dashboards strengthens your ability to detect and respond to issues swiftly.</p>

<p>Logs are another indispensable resource in monitoring. Knowing where they are, how they’re structured, and what types of errors to expect is fundamental. Proactive log analysis can identify problems before they escalate, while post-incident reviews often reveal gaps in detection or response. These insights guide iterative improvements, enhancing system resilience over time.</p>

<p>When incidents occur, a systems administrator’s ability to remain composed and methodical is critical. Troubleshooting demands clear analysis, isolating root causes, and devising immediate workarounds or solutions. This process ensures disruptions are addressed with minimal impact.</p>

<p>Failover mechanisms are another cornerstone of reliability, but their effectiveness depends on realistic design. Too often, failover systems are built for simplistic failure modes, such as complete hardware outages, while more nuanced edge cases—like partial failures or miscommunication between components—are overlooked. For instance, a failure might not propagate properly through the stack, allowing a phone call to proceed along a broken path while bypassing a redundant system that could handle it. Thoughtful failover design, informed by real-world failure scenarios, ensures these mechanisms respond effectively to diverse conditions.</p>

<p>Capacity management is equally important, particularly during failover events. Shifting loads between sites can strain shared resources like SIP trunks and voice channels. Expert administrators anticipate these demands, balancing capacity to prevent overloads and maintain service continuity.</p>

<p>Operational reliability hinges on continuous refinement. Each incident provides lessons—whether from overlooked metrics, delayed alerts, or unforeseen failure modes. Regular evaluations of what worked and what didn’t drive improvements, closing gaps and addressing vulnerabilities. This iterative process ensures systems remain robust, adaptable, and aligned with evolving challenges. By fostering a culture of learning and improvement, systems administrators help maintain customer trust and strengthen the backbone of critical services.</p>

<h3 id="unboxing-metaswitch-rhino-tas-sdk">Unboxing Metaswitch Rhino TAS SDK</h3>

<p>With the clear market need for advanced, customizable UCaaS solutions in mind, I embarked on a Proof-of-Concept deployment of the Metaswitch Rhino Telephony Application Server (TAS). This PoC serves as the foundational first step in demonstrating the capabilities of Rhino TAS and its potential to address the complex requirements of mid-market operators.</p>

<p>This Proof-of-Concept Deployment outlines my efforts to deploy Rhino TAS software, including its SIP Resource Adapter and sample applications, to create a basic SIP PBX. While this represents only a small portion of Rhino TAS’s full capabilities, it serves as an entry point for engaging with the platform and laying the groundwork for broader deployment. By demonstrating this foundational setup, I aim to showcase the platform’s potential and illustrate the critical role of skilled administrators in leveraging its capabilities effectively.</p>

<h4 id="reviewing-vendor-documentation-and-requirements">Reviewing Vendor Documentation and Requirements</h4>

<p>In preparation for this project, I carefully reviewed Metaswitch’s documentation to ensure alignment with their stated requirements and best practices. As an experienced IT professional, I understand the importance of thorough preparation and adhering to vendor specifications, especially in environments as complex as telecom systems. Below are the critical takeaways from the documentation and their implications for my project:</p>

<ol>
  <li>
    <p>Rhino TAS is available in two installer flavors: the “SDK” version, which bundles a free license key for developer testing and evaluation purposes, and the production version, which requires a paid license.</p>
  </li>
  <li>
    <p>The Rhino TAS SDK version has a built-in rate limit to prevent production use, making it strictly for development and testing purposes.</p>
  </li>
  <li>
    <p>The Rhino TAS SDK is supported on Red Hat, CentOS, and Ubuntu Linux distributions. Windows is mentioned but not seriously. For production deployments, only Red Hat Enterprise Linux (RHEL) 8 and 9 are supported.</p>
  </li>
  <li>
    <p>The Rhino TAS SDK supports both Oracle JDK (version 11 only) and OpenJDK (versions 11 or 17). However, OpenJDK must be the version packaged for Red Hat repositories to be supported.</p>
  </li>
  <li>
    <p>Rhino TAS includes an admin web UI called Rhino Element Manager (REM), with two deployment options: embedded and standalone. While JDK 17 support was recently introduced in the latest version, it is currently only available for the standalone REM; the embedded REM still requires JDK 11.</p>
  </li>
</ol>

<h4 id="analysis-and-decision-on-rhino-tas-software-os-and-jdk-selection">Analysis and Decision on Rhino TAS Software, OS and JDK Selection</h4>

<p>After reviewing Metaswitch documentation and considering my requirements, I have decided to deploy the Rhino TAS SDK version on top of Rocky Linux 9.5 with OpenJDK 17 for the PoC. Standalone REM. Below is the rationale behind this decision:</p>

<ol>
  <li>
    <p>The SDK version is the only available version of Rhino TAS for my PoC, making it well-suited for evaluation purposes. While the production version may be available for evaluation to qualified prospects, I did not inquire further as the SDK version meets the requirements for this PoC.</p>
  </li>
  <li>
    <p>Metaswitch’s preference for Red Hat platforms aligns with my decision to use Rocky Linux as a reliable, free RHEL alternative.</p>
  </li>
  <li>
    <p>I prefer OpenJDK over Oracle JDK because OpenJDK remains free for commercial use, unlike Oracle JDK, which typically requires a paid subscription for commercial environments. A well-known caveat in the industry is that Oracle JDK updates are not available through standard package repositories like dnf or apt, requiring manual updates—a time-consuming process that adds unnecessary hassle to system maintenance.</p>
  </li>
  <li>
    <p>OpenJDK 17 offers a clear, long-term lifecycle with public updates until 2029, ensuring stability for the next several years. In contrast, OpenJDK 11, though an LTS release, is already past its End of Public Updates (Sept 2023), making it less viable for long-term use without commercial support. Deploying JDK 11 today risks requiring early re-deployment, while JDK 17 provides more extended support, reducing the need for revisits.</p>
  </li>
  <li>
    <p>Metaswitch has removed Oracle as a supported vendor starting with JDK 17, further supporting the move away from Oracle and reinforcing OpenJDK as the preferred option for future-proofing deployments.</p>
  </li>
  <li>
    <p>Red Hat Enterprise Linux (RHEL) is not available to me and is unlikely to be accessible to hobbyists who might want to follow along with or replicate this project. CentOS is supported, but Rocky Linux is today considered the successor to CentOS as a reliable RHEL clone.</p>
  </li>
  <li>
    <p>Rocky Linux includes the same OpenJDK packages created for Red Hat, making it an excellent choice that aligns with Metaswitch’s recommendations.</p>
  </li>
  <li>
    <p>In telecom, business partners sometimes inquire about underlying systems, especially when the nature of the partnership involves placing a box into the customer’s network. For years, Red Hat has been the best-accepted answer.</p>
  </li>
  <li>
    <p>While it is generally advisable to stick with supported platforms, this is less critical in a PoC environment where vendor support is not accessible. In Metaswitch’s case, even community support is gated behind paid access. Despite this, I chose a configuration that aligns closely with their documented guidance to maintain best practices and ensure compatibility in the absence of external support.</p>
  </li>
</ol>

<h4 id="preparing-the-operating-system">Preparing the Operating System</h4>

<p>The starting point is a basic install from <code class="language-plaintext highlighter-rouge">Rocky-9.5-x86_64-minimal.iso</code> with defaults taken at install time.  I assigned 2 vCPU and 4 GB RAM.  Become the root user or use a privilege escalation mechanism for the commands in this section.</p>

<ol>
  <li>
    <p>Set a hostname.</p>

    <div class="language-bash highlighter-rouge"><div class="highlight"><pre class="highlight"><code>hostnamectl set-hostname RhinoTAS-SDK.lab4.decoursey.com
</code></pre></div>    </div>

    <p><img src="/assets/img/rhino-lab4-hostnamectl.png" alt="shell screenshot" /></p>
  </li>
  <li>
    <p>Create a definition of SIP traffic for the OS-level software firewall.</p>

    <div class="language-bash highlighter-rouge"><div class="highlight"><pre class="highlight"><code><span class="nb">cat</span> <span class="o">&lt;&lt;</span> <span class="no">EOF</span><span class="sh"> &gt; /etc/firewalld/services/sip.xml
&lt;?xml version="1.0" encoding="utf-8"?&gt;
&lt;service&gt;
    &lt;short&gt;SIP&lt;/short&gt;
    &lt;description&gt;Session Initiation Protocol&lt;/description&gt;
    &lt;port protocol="udp" port="5060"/&gt;
    &lt;port protocol="tcp" port="5060"/&gt;
&lt;/service&gt;
</span><span class="no">EOF
</span></code></pre></div>    </div>

    <p><img src="/assets/img/rhino-lab4-firewall-def.png" alt="shell screenshot" /></p>
  </li>
  <li>
    <p>Create a definition of REM traffic for the OS-level software firewall.</p>

    <div class="language-bash highlighter-rouge"><div class="highlight"><pre class="highlight"><code><span class="nb">cat</span> <span class="o">&lt;&lt;</span> <span class="no">EOF</span><span class="sh"> &gt; /etc/firewalld/services/rem.xml
&lt;?xml version="1.0" encoding="utf-8"?&gt;
&lt;service&gt;
    &lt;short&gt;rem&lt;/short&gt;
    &lt;description&gt;Rhino Element Manager&lt;/description&gt;
    &lt;port protocol="tcp" port="8080"/&gt;
&lt;/service&gt;
</span><span class="no">EOF
</span></code></pre></div>    </div>

    <p><img src="/assets/img/rhino-lab4-firewalld-rem.png" alt="shell screenshot" /></p>
  </li>
  <li>
    <p>Reconfigure and reload the OS-level software firewall.</p>

    <div class="language-bash highlighter-rouge"><div class="highlight"><pre class="highlight"><code>firewall-cmd <span class="nt">--permanent</span> <span class="nt">--add-service</span><span class="o">=</span>sip
firewall-cmd <span class="nt">--permanent</span> <span class="nt">--add-service</span><span class="o">=</span>rem
firewall-cmd <span class="nt">--reload</span>
</code></pre></div>    </div>

    <p><img src="/assets/img/rhino-lab4-firewall-cmd.png" alt="shell screenshot" /></p>

    <p>Note: Disabling the firewall temporarily during evaluations is a common shortcut to avoid gathering the system’s connectivity requirements. However, this “temporary” measure often becomes permanent. As the system moves into live use, the temptation to skip proper configuration increases, as administrators are reluctant to make changes in production environments to avoid disruption. The best practice is to define and configure firewall rules early in the deployment process.</p>
  </li>
  <li>
    <p>Run any available updates and, if a kernel update is installed, reboot the machine.</p>

    <div class="language-bash highlighter-rouge"><div class="highlight"><pre class="highlight"><code>dnf <span class="nt">-qy</span> update
shutdown <span class="nt">-r</span> now
</code></pre></div>    </div>

    <p><img src="/assets/img/rhino-lab4-dnf-update.png" alt="shell screenshot" /></p>
  </li>
  <li>
    <p>Install OpenJDK 17.</p>

    <div class="language-bash highlighter-rouge"><div class="highlight"><pre class="highlight"><code>dnf <span class="nt">-qy</span> <span class="nb">install </span>java-17-openjdk-devel
</code></pre></div>    </div>

    <p><img src="/assets/img/rhino-lab4-dnf-install-openjdk.png" alt="shell screenshot" /></p>
  </li>
  <li>
    <p>Install the unzip utility.</p>

    <div class="language-bash highlighter-rouge"><div class="highlight"><pre class="highlight"><code>dnf <span class="nt">-qy</span> <span class="nb">install </span>unzip
</code></pre></div>    </div>

    <p><img src="/assets/img/rhino-lab4-dnf-install-unzip.png" alt="shell screenshot" /></p>
  </li>
  <li>
    <p>Install the tcpdump utility.</p>

    <div class="language-bash highlighter-rouge"><div class="highlight"><pre class="highlight"><code>dnf <span class="nt">-qy</span> <span class="nb">install </span>tcpdump
</code></pre></div>    </div>

    <p><img src="/assets/img/rhino-lab4-dnf-install-tcpdump.png" alt="shell screenshot" /></p>
  </li>
</ol>

<h4 id="creating-the-rhino-tas-user-account">Creating the rhino-tas User Account</h4>

<p>Systems administrators often find themselves building lab systems to hand off to software engineers, application administrators, or other IT professionals. Without clear guidance, these systems can vary widely in configuration, leading to unexpected issues down the line.</p>

<p>Although the Rhino TAS SDK documentation doesn’t explicitly mention it, best practices strongly recommend deploying software under a dedicated, unprivileged user account. Installing it under the root user or, even worse, a personal login account—sometimes mistakenly done—can lead to significant security and operational risks, particularly during the rushed process of deleting login accounts when an employee separates from the company.</p>

<ol>
  <li>
    <p>Create a <code class="language-plaintext highlighter-rouge">rhino-tas</code> user account with a home directory to house and execute the Rhino TAS software.</p>

    <div class="language-bash highlighter-rouge"><div class="highlight"><pre class="highlight"><code>useradd <span class="nt">-r</span> <span class="nt">-m</span> <span class="nt">-d</span> /usr/local/rhino-tas <span class="nt">-s</span> /bin/bash <span class="nt">-c</span> <span class="s2">"Rhino TAS Service Account"</span> rhino-tas
</code></pre></div>    </div>

    <p><img src="/assets/img/rhino-lab4-useradd-rhino-tas.png" alt="shell screenshot" /></p>
  </li>
  <li>
    <p>In professional software packaging, service accounts are given an unusable shell, such as /usr/sbin/nologin. Metaswitch, however, distributes their software as a ZIP file, bypassing the full packaging process and proper daemonization. Given this, and the practical need for on-the-ground operational work and troubleshooting, assigning the interactive shell is a reasonable tradeoff. Locking the account discourages password-based access, mitigating the risk.</p>

    <p>Lock the <code class="language-plaintext highlighter-rouge">rhino-tas</code> user account.</p>

    <div class="language-bash highlighter-rouge"><div class="highlight"><pre class="highlight"><code>passwd <span class="nt">-l</span> rhino-tas
</code></pre></div>    </div>

    <p><img src="/assets/img/rhino-lab4-passwd-rhino-tas.png" alt="shell screenshot" /></p>
  </li>
</ol>

<h4 id="preparing-the-users-java-environment">Preparing the User’s Java Environment</h4>

<ol>
  <li>
    <p>Switch to the rhino-tas user account.</p>

    <div class="language-bash highlighter-rouge"><div class="highlight"><pre class="highlight"><code>su - rhino-tas
</code></pre></div>    </div>

    <p><img src="/assets/img/rhino-lab4-su-rhino-tas.png" alt="shell screenshot" /></p>
  </li>
  <li>
    <p>Setting JAVA_HOME to /usr/lib/jvm/java-17-openjdk ensures the Rhino-TAS shell environment remains stable and survives minor upgrades by leveraging the JDK package’s symbolic links, which automatically point to the correct version. This approach avoids the risks of hard-coded versions, preventing the environment variable from becoming outdated or pointing to a non-existent location during updates.</p>

    <p>Update <code class="language-plaintext highlighter-rouge">~/.bashrc</code>.</p>

    <div class="language-bash highlighter-rouge"><div class="highlight"><pre class="highlight"><code><span class="nb">echo</span> <span class="s2">"export JAVA_HOME=/usr/lib/jvm/java-17-openjdk"</span> <span class="o">&gt;&gt;</span> ~/.bashrc
<span class="nb">echo</span> <span class="s2">"export PATH=</span><span class="se">\$</span><span class="s2">JAVA_HOME/bin:</span><span class="se">\$</span><span class="s2">PATH"</span> <span class="o">&gt;&gt;</span> ~/.bashrc
</code></pre></div>    </div>

    <p><img src="/assets/img/rhino-lab4-export-javahome.png" alt="shell screenshot" /></p>

    <p>Apply the changes.</p>

    <div class="language-bash highlighter-rouge"><div class="highlight"><pre class="highlight"><code><span class="nb">source</span> ~/.bashrc
</code></pre></div>    </div>

    <p><img src="/assets/img/rhino-lab4-source-bashrc.png" alt="shell screenshot" /></p>

    <p>Note: The Rhino TAS SDK auto-generates its configuration file on first startup, capturing the current value of JAVA_HOME at that time. As a result, simply updating JAVA_HOME in the shell environment won’t change the JDK used by the SDK.</p>

    <p>Note: The recommendation in the Rhino SDK Getting Started Guide to update ~/.profile is not suitable for bash-based systems and will typically not work as expected.</p>
  </li>
</ol>

<h4 id="installing-rhino-tas-software-to-the-user-environment">Installing Rhino TAS Software to the User Environment</h4>

<p>Perform these steps, also, as the <code class="language-plaintext highlighter-rouge">rhino-tas</code> user, situated in the <code class="language-plaintext highlighter-rouge">rhino-tas</code> user’s home directory.</p>

<ol>
  <li>
    <p>Download the installer files from https://docs.rhino.metaswitch.com/ocdoc/books/devportal-downloads/1.0/downloads-index/</p>

    <p>You need three things:</p>

    <ul>
      <li>Rhino TAS SDK installer</li>
      <li>SIP Resource Adapter</li>
      <li>REM Standalone Version</li>
    </ul>
  </li>
  <li>
    <p>Transfer the archives to the server and place to the rhino-tas user account’s home directory.</p>

    <div class="language-bash highlighter-rouge"><div class="highlight"><pre class="highlight"><code><span class="nb">ls</span> <span class="nt">-l</span>
</code></pre></div>    </div>

    <p><img src="/assets/img/rhino-lab4-ls-installer-zips.png" alt="shell screenshot" /></p>

    <p>Note: If you’re transferring software files to a server, it’s often easiest to first download them to your desktop. Then, use a file transfer tool like WinSCP or FileZilla to upload the files via SFTP or SCP. Upload them initially to a directory where you have write access, such as your home directory or the <code class="language-plaintext highlighter-rouge">/tmp</code> directory. Afterward, you can SSH into the server, elevate to root, and use commands like <code class="language-plaintext highlighter-rouge">mv</code> and <code class="language-plaintext highlighter-rouge">chown</code> to move the ZIP files into the <code class="language-plaintext highlighter-rouge">~rhino-tas</code> directory and ensure proper ownership.</p>

    <p>Alternatively, you can download the ZIP files directly to the server using command-line tools like <code class="language-plaintext highlighter-rouge">lynx</code> (which may need to be installed). Unlike <code class="language-plaintext highlighter-rouge">wget</code> or <code class="language-plaintext highlighter-rouge">curl</code>, <code class="language-plaintext highlighter-rouge">lynx</code> is recommended because the Metaswitch download site requires you to interactively accept a license agreement, making direct download links elusive.</p>
  </li>
  <li>
    <p>Unzip the Rhino TAS SDK installer</p>

    <div class="language-bash highlighter-rouge"><div class="highlight"><pre class="highlight"><code>unzip <span class="nt">-q</span> rhino-sdk-install-3.2.13.zip
unzip <span class="nt">-q</span> sip-connectivity-3.1.15.zip <span class="nt">-d</span> RhinoSDK/
</code></pre></div>    </div>

    <p><img src="/assets/img/rhino-lab4-unzip-rhino-tas.png" alt="shell screenshot" /></p>
  </li>
  <li>
    <p>cd into the RhinoSDK directory</p>

    <div class="language-bash highlighter-rouge"><div class="highlight"><pre class="highlight"><code><span class="nb">cd </span>RhinoSDK/
</code></pre></div>    </div>

    <p><img src="/assets/img/rhino-lab4-cd-rhinosdk.png" alt="shell screenshot" /></p>
  </li>
  <li>
    <p>Start the service.</p>

    <div class="language-bash highlighter-rouge"><div class="highlight"><pre class="highlight"><code>./start-rhino.sh
</code></pre></div>    </div>

    <p><img src="/assets/img/rhino-lab4-start-rhino.png" alt="shell screenshot" /></p>

    <p>Note: The startup will produce pages of output, and once the service is fully initialized this will show.</p>

    <p><img src="/assets/img/rhino-lab4-start-rhino-tail.png" alt="shell screenshot" /></p>
  </li>
  <li>
    <p>Open a duplicate SSH session and, again, become the rhino-tas user.</p>

    <p>cd into the RhinoSDK directory</p>

    <div class="language-bash highlighter-rouge"><div class="highlight"><pre class="highlight"><code><span class="nb">cd </span>RhinoSDK/
</code></pre></div>    </div>

    <p><img src="/assets/img/rhino-lab4-cd-rhinosdk.png" alt="shell screenshot" /></p>
  </li>
  <li>
    <p>Drill down two more directories into the  cd rhino-connectivity/sip-3.1.15/ directory</p>

    <div class="language-bash highlighter-rouge"><div class="highlight"><pre class="highlight"><code><span class="nb">cd </span>rhino-connectivity/sip-3.1.15/
</code></pre></div>    </div>

    <p><img src="/assets/img/rhino-lab4-cd-sip.png" alt="shell screenshot" /></p>

    <p>Note: You must navigate to this specific directory because the deployexamples.sh script relies on relative path names for its internal commands. This makes the current working directory (CWD) at the time of script execution critical for proper functionality. Skipping this step will result in errors.</p>
  </li>
  <li>
    <p>Edit the sip.properties file to specify a SIP domain name for use in your lab.</p>

    <div class="language-bash highlighter-rouge"><div class="highlight"><pre class="highlight"><code><span class="nb">sed</span> <span class="nt">-i</span> <span class="s1">'s/^PROXY_DOMAINS=.*/PROXY_DOMAINS=lab4.decoursey.com/'</span> sip.properties
</code></pre></div>    </div>

    <p><img src="/assets/img/rhino-lab4-sed-proxydomains.png" alt="shell screenshot" /></p>

    <p>Note: The sed one-liner is clearer to demonstrate, or use a text editor of your choice.</p>
  </li>
  <li>
    <p>Execute the deployexamples script</p>

    <div class="language-bash highlighter-rouge"><div class="highlight"><pre class="highlight"><code>./deployexamples.sh
</code></pre></div>    </div>

    <p><img src="/assets/img/rhino-lab4-deployexamples.png" alt="shell screenshot" /></p>

    <p>Note: this goes on for pages.  It’s done when the prompt returns.  Should end like this:</p>

    <p><img src="/assets/img/rhino-lab4-deployexamples-tail.png" alt="shell screenshot" /></p>
  </li>
</ol>

<h3 id="rhino-element-manager">Rhino Element Manager</h3>

<p>The Rhino TAS SDK does not provide an administrative web UI, but REM (Rhino Element Manager) is a separate component. While its direct relevance to our PoC is unclear, getting it running and connected provides useful familiarity with the platform.</p>

<p>Even if the system is typically managed through other mechanisms, having an admin web UI available can be invaluable when urgent, workaround-type changes are needed outside of normal processes. This sort of flexibility often proves necessary, even when the tool isn’t initially critical to the project.</p>

<p>Using the embedded version would have required downgrading the whole project to JDK 11, so I opted for a standalone setup.</p>

<p>This will be a quick look, and we won’t be bulletproofing the setup since REM won’t be in the call path.</p>

<ol>
  <li>
    <p>Retrieve the file <code class="language-plaintext highlighter-rouge">~rhino-tas/RhinoSDK/rhino-trust.cert</code> from the server and make it available on your desktop PC.</p>

    <p>This file contains the self-signed server certificate generated during the initial startup of the Rhino TAS SDK. REM enforces HTTPS certificate validation for its connection to Rhino TAS SDK, so this certificate must be imported into REM’s trust store via its web UI.</p>

    <p>The file is in DER (Distinguished Encoding Rules) format, a binary format commonly used for storing X.509 certificates. To transfer it, use a tool like WinSCP or FileZilla, as DER files cannot be copied through the clipboard like PEM format.  If you’re curious about its details, you can inspect the certificate using the following command: <code class="language-plaintext highlighter-rouge">openssl x509 -inform DER -in rhino-trust.cert -text -noout</code></p>
  </li>
  <li>
    <p>Retrieve the Rhino TAS SDK password by running the following command:</p>

    <div class="language-bash highlighter-rouge"><div class="highlight"><pre class="highlight"><code><span class="nb">grep</span> ^rhino.remote.password ~rhino-tas/RhinoSDK/client/etc/client.properties
</code></pre></div>    </div>

    <p><img src="/assets/img/rhino-lab4-grep-password.png" alt="shell screenshot" /></p>

    <p>This password was randomly generated during the initial startup of the Rhino TAS SDK and is used to authenticate REM (the external web UI) with the Rhino TAS SDK backend. Once retrieved, you’ll need to supply this password to REM to establish the connection.</p>
  </li>
  <li>
    <p>Unzip the REM software.</p>

    <div class="language-bash highlighter-rouge"><div class="highlight"><pre class="highlight"><code>unzip <span class="nt">-q</span> rhino-element-manager-3.2.10.zip
</code></pre></div>    </div>

    <p><img src="/assets/img/rhino-lab4-unzip-rem.png" alt="shell screenshot" /></p>
  </li>
  <li>
    <p>cd into the REM directory.</p>

    <div class="language-bash highlighter-rouge"><div class="highlight"><pre class="highlight"><code><span class="nb">cd </span>rhino-element-manager-3.2.10
</code></pre></div>    </div>

    <p><img src="/assets/img/rhino-lab4-cd-rem.png" alt="shell screenshot" /></p>
  </li>
  <li>
    <p>Execute the rem.sh script.</p>

    <div class="language-bash highlighter-rouge"><div class="highlight"><pre class="highlight"><code>./rem.sh
</code></pre></div>    </div>

    <p><img src="/assets/img/rhino-lab4-rem-sh.png" alt="shell screenshot" /></p>
  </li>
  <li>
    <p>Navigate to <code class="language-plaintext highlighter-rouge">http://RhinoTAS-SDK:8080/rem</code> in your desktop web browser.
u: emadm
p: password</p>

    <p>Note: Substitute the IP address or (if resolvable) hostname of the server where you’re installing Rhino TAS SDK.</p>
  </li>
  <li>
    <p>Once logged into the REM admin web UI, select Edit Element Manager Users and Roles and set a secure password for both the “emadm” user as well as for the “user” user. Document your new passwords. Do not leave the default passwords.</p>
  </li>
  <li>
    <p>Once logged into the REM admin web UI, select Edit Rhino Instances, click on the “Local” instance, and use the “+” button under Server Cert to upload the server certificate.</p>
  </li>
  <li>
    <p>Navigate back to the REM main menu for example by clicking the home icon at the top right of the interface.  From here, select Manage a Rhino Element.  Select Connect To: and then Local.  Use the option to edit the saved admin credential and supply the password obtained from step 2 above.  Now, retry the Local connetion, which should succeed.</p>

    <p><img src="/assets/img/rhino-lab4-rem-screenshot.png" alt="shell screenshot" /></p>
  </li>
</ol>

<h3 id="testing-and-validation-of-the-rhino-tas-install">Testing and Validation of the Rhino TAS Install</h3>

<p><strong>Spoiler Upfront</strong>: As it turns out, the Rhino TAS platform supports logging, but the sample SIP applications I’m using for my lab do not. These applications also lack endpoints for exposing metrics. While I had initially aimed to showcase log analysis, monitoring and alerting as a key part of this project, I’ve had to adjust my approach. My new plan is to deliver monitoring and alerting as a separate deep-dive project.</p>

<p><strong>Testing Focus</strong>:</p>

<p><strong>Registration Verification</strong>: Can we successfully register soft phones?</p>

<p><strong>Call Placement</strong>: Can we place test calls?</p>

<p>Unfortunately, I can’t showcase my log analysis skills with these samples, as they neither log registration nor calls. However, this isn’t a major issue for the platform itself, as the sample applications are not intended for actual use. Any operator using the platform would develop their applications and incorporate necessary logging and metrics.</p>

<h4 id="setting-up-to-monitor-the-registration-attempt">Setting up to monitor the registration attempt.</h4>

<ol>
  <li>
    <p>The Rhino TAS SDK’s main log file is <code class="language-plaintext highlighter-rouge">RhinoSDK/work/log/rhino.log</code>.  Let’s open a new SSH connection and start tailing the log file so that we’ll see immediately once there is activity.</p>

    <div class="language-bash highlighter-rouge"><div class="highlight"><pre class="highlight"><code><span class="nb">cd </span>RhinoSDK/work/log
</code></pre></div>    </div>

    <p><img src="/assets/img/rhino-lab4-cd-rhinosdk-work-log.png" alt="shell screenshot" /></p>

    <div class="language-bash highlighter-rouge"><div class="highlight"><pre class="highlight"><code><span class="nb">tail</span> <span class="nt">-f</span> rhino.log
</code></pre></div>    </div>

    <p><img src="/assets/img/rhino-lab4-tailf-rhinolog.png" alt="shell screenshot" /></p>

    <p>Note: The tail command displays the last few lines of a text file. The -f option keeps the command running, updating the display with new lines as they are added to the file in real time. This process, called “tailing,” continues until you press [CTRL]-[C] to stop it. For system administrators, tail -f is an essential tool for monitoring live log file activity, making it easier to diagnose issues as they occur.</p>
  </li>
  <li>
    <p>Let’s get a couple more sessions open to the server and, as root, start some packet captures so that once the registration attempt appears on the network, we’ll see real time.</p>

    <p>First, we’ll use tshark (the CLI version of Wireshark) to do a realtime decoding of SIP traffic and dump the analysis to the terminal.</p>

    <div class="language-bash highlighter-rouge"><div class="highlight"><pre class="highlight"><code>tshark <span class="nt">-i</span> enp0s3 <span class="nt">-f</span> <span class="s2">"host 192.168.254.12 and port 5060"</span> <span class="nt">-Y</span> <span class="s2">"sip"</span> <span class="nt">-O</span> sip <span class="nt">-V</span>
</code></pre></div>    </div>

    <p><img src="/assets/img/rhino-lab4-initial-tshark-registration.png" alt="shell screenshot" /></p>

    <p>Second, we’ll simultaneously use tcpdump (in yet another root shell) to get a raw pcap. This permits later offline analysis e.g. using the GUI version of Wireshark, or for sharing with a vendor or partner support or with a customer to request help or to illustrate your point.</p>

    <pre><code class="language-`bash">tcpdump -i enp0s3 -s0 -w Dec20-0405pm.pcap
</code></pre>

    <p><img src="/assets/img/rhino-lab4-initial-tcpdump-registration.png" alt="shell screenshot" /></p>

    <p>Note: Packet capture is a key troubleshooting tool, usually used when diagnosing issues. The tshark command works well for live analysis on the server, giving immediate visibility into SIP traffic. A full pcap is better for doing offline analysis after replicating issues, or sharing with a partner, vendor, or customer for help. If you plan to share the capture, ensure sensitive information is avoided or removed. In this case, I’m setting up the pcap ahead of time to show how it’s done. The IP address 192.168.254.12 is the host where I’ll run the first softphone.</p>
  </li>
</ol>

<h4 id="testing-the-registration-service">Testing the registration service.</h4>

<ol>
  <li>
    <p>Let’s try registering from a softphone client application.  I will use MicroSIP.</p>

    <p><img src="/assets/img/rhino-lab4-microsip.png" alt="shell screenshot" style="max-width: 500px; width: auto; display: block; margin: 0 auto;" /></p>
  </li>
  <li>
    <p>My tshark packet trace session comes alive with this detail.</p>

    <div class="language-plaintext highlighter-rouge"><div class="highlight"><pre class="highlight"><code>Frame 556: 605 bytes on wire (4840 bits), 605 bytes captured (4840 bits)
Ethernet II, Src: Chongqin_11:42:5f (8c:c8:4b:11:42:5f), Dst: PcsCompu_0e:6e:65 (08:00:27:0e:6e:65)
Internet Protocol Version 4, Src: 192.168.254.12, Dst: 192.168.254.51
User Datagram Protocol, Src Port: 59000, Dst Port: 5060
Session Initiation Protocol (REGISTER)
    Request-Line: REGISTER sip:192.168.254.51 SIP/2.0
        Method: REGISTER
        Request-URI: sip:192.168.254.51
            Request-URI Host Part: 192.168.254.51
        [Resent Packet: False]
    Message Header
        Via: SIP/2.0/UDP 192.168.254.12:59000;rport;branch=z9hG4bKPj4c75b6e28e1949cd97d27a5022f94541
            Transport: UDP
            Sent-by Address: 192.168.254.12
            Sent-by port: 59000
            RPort: rport
            Branch: z9hG4bKPj4c75b6e28e1949cd97d27a5022f94541
        Route: &lt;sip:192.168.254.51;lr&gt;
            Route URI: sip:192.168.254.51;lr
                Route Host Part: 192.168.254.51
                Route URI parameter: lr
        Max-Forwards: 70
        From: &lt;sip:1051@lab4.decoursey.com&gt;;tag=bbf84b96e8334f678d44bc05366381ef
            SIP from address: sip:1051@lab4.decoursey.com
                SIP from address User Part: 1051
                SIP from address Host Part: lab4.decoursey.com
            SIP from tag: bbf84b96e8334f678d44bc05366381ef
        To: &lt;sip:1051@lab4.decoursey.com&gt;
            SIP to address: sip:1051@lab4.decoursey.com
                SIP to address User Part: 1051
                SIP to address Host Part: lab4.decoursey.com
        Call-ID: eb8da9f55e3d43bd8d29f48365424ca9
        [Generated Call-ID: eb8da9f55e3d43bd8d29f48365424ca9]
        CSeq: 19789 REGISTER
            Sequence Number: 19789
            Method: REGISTER
        User-Agent: MicroSIP/3.21.5
        Contact: &lt;sip:1051@192.168.254.12:59000;ob&gt;
            Contact URI: sip:1051@192.168.254.12:59000;ob
                Contact URI User Part: 1051
                Contact URI Host Part: 192.168.254.12
                Contact URI Host Port: 59000
                Contact URI parameter: ob
        Expires: 300
        Allow: PRACK, INVITE, ACK, BYE, CANCEL, UPDATE, INFO, SUBSCRIBE, NOTIFY, REFER, MESSAGE, OPTIONS
        Content-Length:  0
    
Frame 559: 453 bytes on wire (3624 bits), 453 bytes captured (3624 bits)
Ethernet II, Src: PcsCompu_0e:6e:65 (08:00:27:0e:6e:65), Dst: Chongqin_11:42:5f (8c:c8:4b:11:42:5f)
Internet Protocol Version 4, Src: 192.168.254.51, Dst: 192.168.254.12
User Datagram Protocol, Src Port: 5060, Dst Port: 59000
Session Initiation Protocol (200)
    Status-Line: SIP/2.0 200 OK
        Status-Code: 200
        [Resent Packet: False]
        [Request Frame: 556]
        [Response Time (ms): 234]
    Message Header
        Via: SIP/2.0/UDP 192.168.254.12:59000;rport=59000;branch=z9hG4bKPj4c75b6e28e1949cd97d27a5022f94541
            Transport: UDP
            Sent-by Address: 192.168.254.12
            Sent-by port: 59000
            RPort: 59000
            Branch: z9hG4bKPj4c75b6e28e1949cd97d27a5022f94541
        From: &lt;sip:1051@lab4.decoursey.com&gt;;tag=bbf84b96e8334f678d44bc05366381ef
            SIP from address: sip:1051@lab4.decoursey.com
                SIP from address User Part: 1051
                SIP from address Host Part: lab4.decoursey.com
            SIP from tag: bbf84b96e8334f678d44bc05366381ef
        To: &lt;sip:1051@lab4.decoursey.com&gt;
            SIP to address: sip:1051@lab4.decoursey.com
                SIP to address User Part: 1051
                SIP to address Host Part: lab4.decoursey.com
        Call-ID: eb8da9f55e3d43bd8d29f48365424ca9
        [Generated Call-ID: eb8da9f55e3d43bd8d29f48365424ca9]
        CSeq: 19789 REGISTER
            Sequence Number: 19789
            Method: REGISTER
        Contact: &lt;sip:1051@192.168.254.12:59000;ob&gt;;expires=300;q=0.0
            Contact URI: sip:1051@192.168.254.12:59000;ob
                Contact URI User Part: 1051
                Contact URI Host Part: 192.168.254.12
                Contact URI Host Port: 59000
                Contact URI parameter: ob
            Contact parameter: expires=300
            Contact parameter: q=0.0
        Date: Fri, 20 Dec 2024 21:30:53 GMT
        Content-Length: 0
</code></pre></div>    </div>

    <p>This is a successful SIP registration. The system allowed registration without any configuration for the user or extension. Keep in mind, this is a sample application designed to help developers get started with SIP. Authentication is not implemented to keep the setup simple for initial development.</p>

    <p>The source code for the registration functionality can be found in the file RhinoSDK/rhino-connectivity/sip-3.1.15/src/com/opencloud/slee/services/sip/registrar/RegistrarSbb.java. There is a placeholder comment where authentication and authorization would be added.</p>

    <p>Note: The registration process typically follows a challenge-response strategy. The client sends a REGISTER request without credentials, and the server responds with a 401 Unauthorized message, prompting the client to provide the correct credentials. Seeing the 401 Unauthorized response is normal and simply indicates the server is prompting for credentials.</p>
  </li>
</ol>

<h4 id="error-observed-in-the-platform-logs">Error observed in the platform logs</h4>

<p>Recall I was tailing the log file during the registration process.  I did notice an error.</p>

<div class="language-plaintext highlighter-rouge"><div class="highlight"><pre class="highlight"><code>2024-12-21 02:30:18.812-0500 Warning [trace.sipra.sip.fail] &lt;sipra/IO/0&gt; {} incoming message from /192.168.254.12:57898 rejected: parse failed, drop message
message buffer contents:

java.text.ParseException: no character matching rule token found at current index, buf=""
         at com.opencloud.slee.resources.sip.parser.Lexer.makeParseException(Lexer.java:799)
         at com.opencloud.slee.resources.sip.parser.Lexer.getCharacterSequence(Lexer.java:777)
         at com.opencloud.slee.resources.sip.parser.Lexer.getCharacterSequence(Lexer.java:742)
         at com.opencloud.slee.resources.sip.parser.Lexer.getNextToken(Lexer.java:630)
         at com.opencloud.slee.resources.sip.parser.SipParser.parseFirstLine(SipParser.java:345)
         at com.opencloud.slee.resources.sip.parser.SipParser.parseFirstLine(SipParser.java:241)
         at com.opencloud.slee.resources.sip.transport.handler.SipMessageDecoder.decodeStep(SipMessageDecoder.java:137)
         at com.opencloud.slee.resources.sip.transport.handler.SipMessageDecoder.decode(SipMessageDecoder.java:105)
         at io.netty.handler.codec.ByteToMessageDecoder.decodeRemovalReentryProtection(ByteToMessageDecoder.java:529)            at io.netty.handler.codec.ByteToMessageDecoder.callDecode(ByteToMessageDecoder.java:468)
         at io.netty.handler.codec.ByteToMessageDecoder.channelRead(ByteToMessageDecoder.java:290)
         at io.netty.channel.AbstractChannelHandlerContext.invokeChannelRead(AbstractChannelHandlerContext.java:444)
         at io.netty.channel.AbstractChannelHandlerContext.invokeChannelRead(AbstractChannelHandlerContext.java:420)
         at io.netty.channel.AbstractChannelHandlerContext.fireChannelRead(AbstractChannelHandlerContext.java:412)
         at com.opencloud.slee.resources.sip.transport.handler.NetworkEventHandler.channelRead(NetworkEventHandler.java:155)
[ ... snipped for brevity ... ]
</code></pre></div></div>

<p>This is a Java stack trace, which is a standardized format for error messages in Java applications. Stack traces are human-readable to some extent and often provide clues as to what went wrong. In this case, it appears that the server encountered an issue while trying to parse a SIP message, indicating that the message was invalid.</p>

<p>Stack traces are especially useful because they usually include the filename and line number from the source code where the error occurred. If you have access to the source code, this can be extremely helpful for troubleshooting. When analyzing a stack trace, start from the top.</p>

<p>The registration was successful, which suggests a benign (noise) error — one that appears in the logs but doesn’t affect normal usage. From tailing the logs in real time, it was clear that the error occurred about every 15 seconds, which didn’t even align with the registration interval, but rather aligned with the keep-alives. This pointed to the error being caused by MicroSIP not properly formatting the keep-alive packets. Even though these packets don’t need to be processed by the server — they’re only meant to maintain the network path through stateful firewalls or NAT gateways — more care should have been taken in their implementation. It appears to be a minor bug on the MicroSIP side, causing invalid requests.</p>

<p>My solution was to disable the keep-alives and reduce the registration interval to 120 seconds, which should be plenty frequent enough to keep the connection alive.</p>

<h4 id="testing-the-proxy-service">Testing the proxy service</h4>

<p>In setting up for the test call, I have again started packet captures.  This time, I am doing simultaneous packet capture on the PBX server as well as on the callee’s machine, covering the duration of the test call.</p>

<div class="language-bash highlighter-rouge"><div class="highlight"><pre class="highlight"><code> tcpdump <span class="nt">-i</span> enp0s3 <span class="nt">-s0</span> <span class="nt">-w</span> Dec21-0409pm.pcap
</code></pre></div></div>

<p><img src="/assets/img/rhino-lab4-call-tcpdump.png" alt="shell screenshot" /></p>

<p>Note: When using <code class="language-plaintext highlighter-rouge">tcpdump</code> on Linux, including a file extension like .pcap is good practice. Though not required by Linux, it ensures the file is easily recognizable and opens correctly in tools like Wireshark on other systems. Without the extension, the file might need to be opened manually or renamed for proper recognition.</p>

<p>I have registered two soft phones: ext. 1050 is situated on 192.168.254.52 and ext. 1051 situated on 192.168.254.12.</p>

<p>The Rhino PBX SDK server is 192.168.254.51.</p>

<p>The test will involve ext. 1050 calling ext. 1051.</p>

<p><img src="/assets/img/rhino-lab4-wireshark-callflow.png" alt="shell screenshot" /></p>

<p>The packet capture taken during the test call reveals the dual nature of the call flow from the PBX’s perspective. Positioned as the middlebox, the PBX handles both the inbound leg from the caller and the outbound leg toward the callee in a unified manner.</p>

<p>The SIP protocol governs the signaling phase of this communication. In this exercise, I captured the full handshake sequence, showcasing both the SIP INVITE and its corresponding 200 OK responses from each leg of the call.</p>

<h4 id="the-invite-process">The INVITE Process</h4>

<p>Here’s the INVITE from the caller’s softphone to the PBX:</p>

<div class="language-plaintext highlighter-rouge"><div class="highlight"><pre class="highlight"><code>INVITE sip:1051@lab4.decoursey.com SIP/2.0
Via: SIP/2.0/UDP 192.168.254.52:63999;rport;branch=z9hG4bKPjad86691ceb7f487983238fe4d8da55b0
From: "Laptop Softphone" &lt;sip:1050@lab4.decoursey.com&gt;;tag=e778c0943dee4a86a1dac5cd95729d32
To: &lt;sip:1051@lab4.decoursey.com&gt;
Contact: "Laptop Softphone" &lt;sip:1050@192.168.254.52:63999;ob&gt;
Call-ID: 7111c5ccb078431d94b2fa1ddc3f1c7a
CSeq: 7081 INVITE
Content-Type: application/sdp
Content-Length: 346

v=0
o=- 3943786649 3943786649 IN IP4 192.168.254.52
s=pjmedia
c=IN IP4 192.168.254.52
t=0 0
m=audio 4010 RTP/AVP 8 0 101
a=rtpmap:8 PCMA/8000
a=rtpmap:0 PCMU/8000
a=rtpmap:101 telephone-event/8000
a=fmtp:101 0-16
a=sendrecv
</code></pre></div></div>

<p>The PBX processes and relays the INVITE to the callee:</p>

<div class="language-plaintext highlighter-rouge"><div class="highlight"><pre class="highlight"><code>INVITE sip:1051@192.168.254.12:62181;ob SIP/2.0
Via: SIP/2.0/UDP 192.168.254.51:5060;branch=z9hG4bKa246d7f899643f59a1937bd5941b1e73;rport
From: "Laptop Softphone" &lt;sip:1050@lab4.decoursey.com&gt;;tag=e778c0943dee4a86a1dac5cd95729d32
To: &lt;sip:1051@lab4.decoursey.com&gt;
Contact: "Laptop Softphone" &lt;sip:1050@192.168.254.52:63999;ob&gt;
Call-ID: 7111c5ccb078431d94b2fa1ddc3f1c7a
CSeq: 7081 INVITE
Record-Route: &lt;sip:192.168.254.51:5060;transport=UDP;lr&gt;
Content-Type: application/sdp
Content-Length: 346

v=0
o=- 3943786649 3943786649 IN IP4 192.168.254.52
s=pjmedia
c=IN IP4 192.168.254.52
t=0 0
m=audio 4010 RTP/AVP 8 0 101
a=rtpmap:8 PCMA/8000
a=rtpmap:0 PCMU/8000
a=rtpmap:101 telephone-event/8000
a=fmtp:101 0-16
a=sendrecv
</code></pre></div></div>

<h4 id="the-200-ok-responses">The 200 OK Responses</h4>

<p>The callee responds with a 200 OK:</p>

<div class="language-plaintext highlighter-rouge"><div class="highlight"><pre class="highlight"><code>SIP/2.0 200 OK
Via: SIP/2.0/UDP 192.168.254.51:5060;branch=z9hG4bKa246d7f899643f59a1937bd5941b1e73;rport
From: "Laptop Softphone" &lt;sip:1050@lab4.decoursey.com&gt;;tag=e778c0943dee4a86a1dac5cd95729d32
To: &lt;sip:1051@lab4.decoursey.com&gt;;tag=e12935090f894164886200e94f61a828
Call-ID: 7111c5ccb078431d94b2fa1ddc3f1c7a
CSeq: 7081 INVITE
Contact: &lt;sip:1051@192.168.254.12:62181;ob&gt;
Content-Type: application/sdp
Content-Length: 321

v=0
o=- 3943786647 3943786648 IN IP4 192.168.254.12
s=pjmedia
c=IN IP4 192.168.254.12
t=0 0
m=audio 4018 RTP/AVP 8 101
a=rtpmap:8 PCMA/8000
a=rtpmap:101 telephone-event/8000
a=fmtp:101 0-16
a=sendrecv
</code></pre></div></div>

<p>The PBX forwards the 200 OK back to the caller:</p>

<div class="language-plaintext highlighter-rouge"><div class="highlight"><pre class="highlight"><code>SIP/2.0 200 OK
Via: SIP/2.0/UDP 192.168.254.52:63999;branch=z9hG4bKPjad86691ceb7f487983238fe4d8da55b0;rport
From: "Laptop Softphone" &lt;sip:1050@lab4.decoursey.com&gt;;tag=e778c0943dee4a86a1dac5cd95729d32
To: &lt;sip:1051@lab4.decoursey.com&gt;;tag=e12935090f894164886200e94f61a828
Call-ID: 7111c5ccb078431d94b2fa1ddc3f1c7a
CSeq: 7081 INVITE
Contact: &lt;sip:1051@192.168.254.12:62181;ob&gt;
Content-Type: application/sdp
Content-Length: 321

v=0
o=- 3943786647 3943786648 IN IP4 192.168.254.12
s=pjmedia
c=IN IP4 192.168.254.12
t=0 0
m=audio 4018 RTP/AVP 8 101
a=rtpmap:8 PCMA/8000
a=rtpmap:101 telephone-event/8000
a=fmtp:101 0-16
a=sendrecv
</code></pre></div></div>

<h4 id="media-stream-prediction">Media Stream Prediction</h4>

<p>The 200 OK response is more than just an acknowledgment; it also informs the caller about where and how to set up the media stream. Specifically, the SDP in the 200 OK indicates the callee’s media connection details:</p>

<ul>
  <li>Media IP: 192.168.254.12</li>
  <li>Media Port: 4018</li>
</ul>

<p>Given this, we predict the RTP stream from the caller to the callee will originate from 192.168.254.52:4010 and terminate at 192.168.254.12:4018. In the reverse direction, the RTP stream will start at 192.168.254.12:4018 and end at 192.168.254.52:4010.</p>

<h4 id="validating-with-callees-pcap">Validating with Callee’s PCAP</h4>

<p>Using the callee’s packet capture to analyze RTP streams:</p>

<div class="language-plaintext highlighter-rouge"><div class="highlight"><pre class="highlight"><code>lincoln@DESKTOP-LINCOLN:~$ tshark -r callee.pcapng -q -z rtp,streams
========================= RTP Streams ========================
   Start time      End time     Src IP addr  Port    Dest IP addr  Port       SSRC          Payload  Pkts         Lost   Min Delta(ms)  Mean Delta(ms)   Max Delta(ms)  Min Jitter(ms) Mean Jitter(ms)  Max Jitter(ms) Problems?
    29.685967     35.505983  192.168.254.12  4018  192.168.254.52  4010 0x2CD504B0            g711A   292     0 (0.0%)           9.838          20.000          30.307           0.004           1.312           3.256
    29.681122     35.581229  192.168.254.52  4010  192.168.254.12  4018 0x4B7129E9            g711A   296     0 (0.0%)          11.710          20.000          28.212           0.014           0.388           1.507
==============================================================
lincoln@DESKTOP-LINCOLN:~$
</code></pre></div></div>

<p>As predicted, the RTP streams flow directly between the endpoints without PBX intervention, confirming the separation of signaling and media typical in SIP.</p>

<p>The PBX’s role as a signaling intermediary is evident in its use of Record-Route headers and relaying of SIP messages. However, it does not act as a media proxy; the RTP flows directly between endpoints. This separation of signaling and media, characteristic of SIP, underscores its efficiency in network resource usage.</p>

<h3 id="conclusion">Conclusion</h3>

<p>Reflecting on this project, I am eager to bring my skills and experience to a team committed to operational excellence. The challenges of ensuring system reliability and delivering seamless service are ones I approach with respect and enthusiasm. I look forward to stepping into a role where I can contribute to building robust, well-monitored systems that support the highest standards of performance and reliability.</p>

<p>This proof-of-concept lab underscores my proactive mindset and readiness to engage with the real-world complexities of systems administration. While I know there is always more to learn, I am excited by the opportunity to grow alongside a team that values precision, stability, and continuous improvement.</p>

<p>My focus is on delivering excellence—leveraging my skills in monitoring, troubleshooting, and maintaining critical infrastructure, while embracing new challenges with humility and determination. I am eager to collaborate, learn, and contribute to ensuring the success of the systems and the people who rely on them. Together, we can tackle the demands of this ever-evolving field and achieve outstanding results.</p>]]></content><author><name></name></author><summary type="html"><![CDATA[Overview]]></summary></entry><entry><title type="html">VyOS HA in Vultr with BGP and VRRP</title><link href="http://localhost:4000/2024/03/04/vyos-bgp-to-vultr.html" rel="alternate" type="text/html" title="VyOS HA in Vultr with BGP and VRRP" /><published>2024-03-04T03:00:00-05:00</published><updated>2024-03-04T03:00:00-05:00</updated><id>http://localhost:4000/2024/03/04/vyos-bgp-to-vultr</id><content type="html" xml:base="http://localhost:4000/2024/03/04/vyos-bgp-to-vultr.html"><![CDATA[<p><b>Introduction</b></p>

<p>In a previous post, I introduced VyOS and Vultr and teased follow-up posts that would show the deployment of VyOS
as an edge router and perimeter firewall in front of an internal network, which would amount to a novel 
solution for the VPS space, where nothing like that is typically considered.</p>

<p>The technical work is complete to proof-of-concept standards.  My personal domain’s core services are now
self-operated by me, at Vultr, behind paired VyOS edge routers, with firewalling, network segmentation, dual-stack
IPv4 &amp; IPv6, and DNSSEC signing.  This includes authoritative DNS, email, and web service for this blog.</p>

<p>In each of my next several posts, I’ll pick one aspect of the solution and deep dive it, in order to stay
true to my IT philosophy and my plan (see my “About” page) for this blog:</p>

<blockquote>
  <p>Just about anybody can slam something in quickly and haul butt. That’s not how to succeed in IT,
and that’s not where I’m at in this stage of life. I want to set myself apart by doing it well,
and by using the blog to document along the way.</p>
</blockquote>

<p>Topics will include redundancy, firewall, network segmentation (WAN, DMZ and intranet), remote access VPN, dual-stack
IPv4 and IPv6, provisioning automation, configuration management, logging, monitoring and alerting.  Beyond the VyOS
network devices themselves, afterward, I’m apt to move on to talk about the core Internet services, and how I operate
these within the DMZ, in a Linux environment.</p>

<p><b>Today’s topic</b></p>

<p>The first deep dive topic centers around redundancy and fail-over.  I will start with some background and guiding
principles, then focus in on network device redundancy generally, talk about where VyOS and Vultr come in on this,
then select, implement, and validate my solution for VyOS HA in Vultr.</p>

<p><b>Background</b></p>

<p>In professional IT, going to production involves addressing redundancy.  You will see terms like active/active,
active/standby, manual and automatic fail-over, and you will encounter redundancy deployed both within
the data center as well as schemes involving two or more data centers.</p>

<p>Engineering for redundancy adds cost and introduces complexity, all of which must be weighed, prioritized, and
expertly balanced.</p>

<p><b>Dos and Don’ts:</b></p>
<ol>
  <li><b>Do</b> have an idea of the SLAs and SLOs to be hit before proceeding to design.</li>
  <li><b>Do</b> brainstorm likely failure scenarios to address in your initial design.</li>
  <li><b>Do</b> pay special attention to failure modes where a server is merely off in the weeds, or has lost connectivity
to a backend, not just the case where the server dies outright.</li>
  <li><b>Do</b> test and validate your fail-over mechanisms to the best of your ability.</li>
  <li><b>Do</b> incorporate alerting to be notified of the problem: if fail-over works, you won’t see an outage.</li>
  <li><b>Do</b> understand and document any caveats of the failover mechanism, such as degraded UI, or if users will need
to log back in.  Be up-front with stakeholders.</li>
  <li>
    <p><b>Do</b> postmortems to discuss what worked, what didn’t, and where you find room to improve, do so.</p>
  </li>
  <li><b>Don’t</b> obsess over the first-pass design.  What’s important is that you have some HA story to go to market.
The rest will come from hard-won experience.  “Why didn’t the fail-over work?” is a question executives will ask.
“It was an edge case and we’re fixing it.”</li>
  <li><b>Don’t</b> think about how clever you can look today. Think 9 months down the line when whatever you put in today
will need to be manipulated and leveraged during an emergency.  Can you be back up to speed with it in 5 minutes,
and teach it to somebody else in 10 minutes?</li>
  <li><b>Don’t</b> allow in excess complexity to the point it becomes counter-productive.  You can trip over your own
feet, causing the outage you had aimed to prevent.</li>
</ol>

<blockquote>
  <p>Flashy isn’t the goal; adopting a solution that meets your company’s needs and that your team can
effectively implement and manage is.</p>
</blockquote>

<p><b>Network device redundancy</b></p>

<p>Enterprise-grade network gear has a reputation of being extremely reliable.  Failures are not expected to occur
within the useful life of a device.  Because both the up-front and ongoing maintenance costs for enterprise network
devices are considerable, and because these devices have to compete for attention with other, more-likely failure
points in contingency planning, not all projects will deploy redundant network hardware.</p>

<p>That said, the failure of a core piece of network gear, apart from a redundant counterpart, will mean at least
hours of site downtime, especially when equipment is placed in third-party data centers where external
partners, namely remote-hands technicians and vendor service personnel, are relied upon to respond.</p>

<p>What is more, a secondary device stands by not only for the failure of the primary device, but also to cover during
maintenance, permitting advisory-only (“no impact is anticipated”) maintenance window notifications.  Finally, when
unexpected problems do occur with maintenance, these can oftentimes be detected before progressing to the secondary
firewall, avoiding outages in scenarios of bad updates or configuration mistakes.</p>

<p><b>Today’s challenge</b></p>

<p>The Virtual Router Redundancy Protocol (VRRP) became a standard approach for ensuring network redundancy in production
environments during the mid-2000s. Through VRRP, primary and secondary routers use heartbeats to check each other’s
status, facilitating automatic fail-over to ensure continuous network operation and redundancy.</p>

<p>Border Gateway Protocol (BGP) can work in tandem with VRRP to manage WAN IP addressing across edge routers. With VRRP
establishing primary and secondary roles for routers, ensuring internal network redundancy, BGP handles the external
routing, allowing the WAN IP to “float” or transition seamlessly between the edge routers during fail-over events.</p>

<p>The VyOS manual’s chapter on HA is built around VRRP entirely, and Vultr’s KB has an article called
“High Availability on Vultr with Floating IP and BGP” with sample configuration that we should
be able to port to VyOS, since VyOS will definitely have robust support for BGP.</p>

<p><b>Architecture of the solution</b></p>

<p>Each edge router will have a dedicated external IP unique to it, but my domain’s core Internet services will be
advertised on separate floating “service” IP addresses that are routed to my edge devices on their primary IPs
using BGP ECMP/anycast, but with my primary edge device prioritized using AS path prepend.</p>

<p>I will have two public IPs (a primary and a secondary) for each of my three core services (DNS, SMTP, HTTPS) for a
total of six floating public IPs.  I will prioritize the same edge router in the VRRP configuration and hope that
BGP and VRRP stay in sync; roughly, they should.  I will also use a conntrack sync mechanism in attempt to cover
some of the gray area and to avoid session drops during failover.</p>

<p>VRRP is a first hop redundancy protocol, and does not address whether the active router is actually
capable of forwarding packets further.  A dynamic interior protocol like OSPF could potentially do a better job
to integrate with BGP, but I don’t have a comfort level to push anything like that to production, and all of the
community documentation, which I will rely on, says VRRP.  I would rather accept risk of an unlikely-to-encounter
edge case for nonconvergence than to put in a too-complex solution that I’m not the master of: it would be a security
risk and counter-productive to stability.</p>

<p>OSPF is something I would love to play with in the near future and I will do that in a lab environment where I plan
to operate a routing core in addition to edge routers.</p>

<p><b>BGP peering with Vultr</b></p>

<p>BGP prefix-lists</p>

<div class="language-plaintext highlighter-rouge"><div class="highlight"><pre class="highlight"><code>set policy prefix-list VULTR-NJ-v4 rule 10 action 'permit'
set policy prefix-list VULTR-NJ-v4 rule 10 prefix '45.76.4.167/32'
set policy prefix-list VULTR-NJ-v4 rule 20 action 'permit'
set policy prefix-list VULTR-NJ-v4 rule 20 prefix '45.76.6.22/32'
set policy prefix-list VULTR-NJ-v4 rule 30 action 'permit'
set policy prefix-list VULTR-NJ-v4 rule 30 prefix '45.76.10.33/32'
set policy prefix-list VULTR-NJ-v4 rule 40 action 'permit'
set policy prefix-list VULTR-NJ-v4 rule 40 prefix '45.76.6.7/32'
set policy prefix-list VULTR-NJ-v4 rule 50 action 'permit'
set policy prefix-list VULTR-NJ-v4 rule 50 prefix '45.76.6.121/32'
set policy prefix-list VULTR-NJ-v4 rule 60 action 'permit'
set policy prefix-list VULTR-NJ-v4 rule 60 prefix '45.76.11.196/32'
set policy prefix-list VULTR-NJ-v4 rule 70 action 'permit'
set policy prefix-list VULTR-NJ-v4 rule 70 prefix '45.63.21.196/32'
set policy prefix-list6 VULTR-NJ-v6 rule 10 action 'permit'
set policy prefix-list6 VULTR-NJ-v6 rule 10 prefix '2001:19f0:5:416::/64'
set policy prefix-list6 VULTR-NJ-v6 rule 20 action 'permit'
set policy prefix-list6 VULTR-NJ-v6 rule 20 prefix '2001:19f0:1000:6946::/64'
set policy prefix-list6 VULTR-NJ-v6 rule 30 action 'permit'
set policy prefix-list6 VULTR-NJ-v6 rule 30 prefix '2001:19f0:5:34cd::/64'
</code></pre></div></div>

<p>BGP route maps (don’t be that guy)</p>
<div class="language-plaintext highlighter-rouge"><div class="highlight"><pre class="highlight"><code>set policy route-map 64515v4-IN rule 10 action 'deny'
set policy route-map 64515v4-OUT rule 10 action 'permit'
set policy route-map 64515v4-OUT rule 10 match ip address prefix-list 'VULTR-NJ-v4'
set policy route-map 64515v6-IN rule 10 action 'deny'
set policy route-map 64515v6-OUT rule 10 action 'permit'
set policy route-map 64515v6-OUT rule 10 match ipv6 address prefix-list 'VULTR-NJ-v6'
</code></pre></div></div>

<p>Private AS peer to Vultr</p>

<div class="language-plaintext highlighter-rouge"><div class="highlight"><pre class="highlight"><code>set protocols bgp 4288000595 address-family ipv4-unicast network 45.63.21.196/32
set protocols bgp 4288000595 address-family ipv4-unicast network 45.76.4.167/32
set protocols bgp 4288000595 address-family ipv4-unicast network 45.76.6.7/32
set protocols bgp 4288000595 address-family ipv4-unicast network 45.76.6.22/32
set protocols bgp 4288000595 address-family ipv4-unicast network 45.76.6.121/32
set protocols bgp 4288000595 address-family ipv4-unicast network 45.76.10.33/32
set protocols bgp 4288000595 address-family ipv4-unicast network 45.76.11.196/32
set protocols bgp 4288000595 address-family ipv6-unicast network 2001:19f0:5:34cd::/64
set protocols bgp 4288000595 address-family ipv6-unicast network 2001:19f0:5:416::/64
set protocols bgp 4288000595 address-family ipv6-unicast network 2001:19f0:1000:6946::/64
set protocols bgp 4288000595 neighbor 169.254.169.254 address-family ipv4-unicast nexthop-self force
set protocols bgp 4288000595 neighbor 169.254.169.254 address-family ipv4-unicast remove-private-as
set protocols bgp 4288000595 neighbor 169.254.169.254 address-family ipv4-unicast route-map export '64515v4-OUT'
set protocols bgp 4288000595 neighbor 169.254.169.254 address-family ipv4-unicast route-map import '64515v4-IN'
set protocols bgp 4288000595 neighbor 169.254.169.254 ebgp-multihop '2'
set protocols bgp 4288000595 neighbor 169.254.169.254 password 'redactedP@ssw0rd'
set protocols bgp 4288000595 neighbor 169.254.169.254 remote-as '64515'
set protocols bgp 4288000595 neighbor 2001:19f0:ffff::1 address-family ipv6-unicast nexthop-self force
set protocols bgp 4288000595 neighbor 2001:19f0:ffff::1 address-family ipv6-unicast remove-private-as
set protocols bgp 4288000595 neighbor 2001:19f0:ffff::1 address-family ipv6-unicast route-map export '64515v6-OUT'
set protocols bgp 4288000595 neighbor 2001:19f0:ffff::1 address-family ipv6-unicast route-map import '64515v6-IN'
set protocols bgp 4288000595 neighbor 2001:19f0:ffff::1 ebgp-multihop '2'
set protocols bgp 4288000595 neighbor 2001:19f0:ffff::1 password 'redactedP@ssw0rd'
set protocols bgp 4288000595 neighbor 2001:19f0:ffff::1 remote-as '64515'
set protocols bgp 4288000595 parameters router-id '45.76.0.255'
</code></pre></div></div>

<p><b>VRRP configuration inside</b></p>
<div class="language-plaintext highlighter-rouge"><div class="highlight"><pre class="highlight"><code>set high-availability vrrp group vpc-nj-dmz-v4vip interface 'eth1'
set high-availability vrrp group vpc-nj-dmz-v4vip priority '200'
set high-availability vrrp group vpc-nj-dmz-v4vip virtual-address 10.76.2.1/24
set high-availability vrrp group vpc-nj-dmz-v4vip vrid '21'
set high-availability vrrp group vpc-nj-dmz-v6vip interface 'eth1'
set high-availability vrrp group vpc-nj-dmz-v6vip priority '200'
set high-availability vrrp group vpc-nj-dmz-v6vip virtual-address 2001:19f0:5:416::1/64
set high-availability vrrp group vpc-nj-dmz-v6vip vrid '22'
set high-availability vrrp group vpc-nj-intranet-v4vip interface 'eth2'
set high-availability vrrp group vpc-nj-intranet-v4vip priority '200'
set high-availability vrrp group vpc-nj-intranet-v4vip virtual-address 10.76.4.1/24
set high-availability vrrp group vpc-nj-intranet-v4vip vrid '41'
set high-availability vrrp group vpc-nj-intranet-v6vip interface 'eth2'
set high-availability vrrp group vpc-nj-intranet-v6vip priority '200'
set high-availability vrrp group vpc-nj-intranet-v6vip virtual-address 2001:19f0:5:34cd::1/64
set high-availability vrrp group vpc-nj-intranet-v6vip vrid '42'
set high-availability vrrp sync-group MAIN member 'vpc-nj-dmz-v4vip'
set high-availability vrrp sync-group MAIN member 'vpc-nj-dmz-v6vip'
set high-availability vrrp sync-group MAIN member 'vpc-nj-intranet-v4vip'
set high-availability vrrp sync-group MAIN member 'vpc-nj-intranet-v6vip'
</code></pre></div></div>

<p><b>conntrack sync</b></p>
<div class="language-plaintext highlighter-rouge"><div class="highlight"><pre class="highlight"><code>set service conntrack-sync failover-mechanism vrrp sync-group 'MAIN'
set service conntrack-sync interface eth1
set system conntrack modules ftp
set system conntrack modules h323
set system conntrack modules nfs
set system conntrack modules pptp
set system conntrack modules sip
set system conntrack modules sqlnet
set system conntrack modules tftp
</code></pre></div></div>]]></content><author><name></name></author><summary type="html"><![CDATA[Introduction]]></summary></entry><entry><title type="html">VyOS Platform build for Vultr Cloud</title><link href="http://localhost:4000/2024/01/11/vyos-build-for-vultr.html" rel="alternate" type="text/html" title="VyOS Platform build for Vultr Cloud" /><published>2024-01-11T21:00:00-05:00</published><updated>2024-01-11T21:00:00-05:00</updated><id>http://localhost:4000/2024/01/11/vyos-build-for-vultr</id><content type="html" xml:base="http://localhost:4000/2024/01/11/vyos-build-for-vultr.html"><![CDATA[<p><b>Introduction</b></p>

<p>Virtual Private Server (VPS) offerings have, forever, remained popular with hobbyists due to their unmatched
accessibility.  Compared to how IT professionals approach entry to any new data center, however, deployment to a VPS
provider involves serious compromises.  Both internal switching and the perimeter firewall are absent, precluding
the involvement of logical network designs from modern IT.</p>

<p>Public cloud offerings, situated adjacent to VPS, do offer solutions, but cloud engineering, while accepted as 
competing well in the marketplace of ideas, is a distinct IT practice area.  The presence of outsourcing as an
alternative to infrastructure ownership does not constitute a solution to the problem of a missing low-barrier
sandbox for learning and practicing traditional IT skills such as systems and network administration.</p>

<p>Let’s introduce two key players: VyOS, and Vultr, and propose these as partners in a potential solution.</p>

<p>VyOS is an open-source network operating system for x86-64 architecture.  VyOS is directly comparable to Cisco and
Juniper in terms of protocol support and configuration syntax.  VyOS looks, feels and plays like an enterprise-grade
router, and skills learned deploying and managing VyOS are enterprise skills.</p>

<p>VyOS differentiates itself in the marketplace on two key points:</p>
<ol>
  <li>instead of a physical device needing to be purchased and racked, it is a software solution, and</li>
  <li>instead of closed-source or open-core model software, it is fully open-source software.</li>
</ol>

<p>Vultr, unlike a bare-bones VPS provider, does tackle the modern IaaS market, but it retains a pricing structure
and user interface that are each recognizable to the traditional VPS consumer.  Vultr is well-regarded, and highly
performant, and it offers a free trial for new signups.</p>

<p>Here are what I consider to be Vultr’s key features:</p>
<ol>
  <li>presence in the Terraform registry,</li>
  <li>KVM-based virtualization with cloud-init support,</li>
  <li>internal “VPC” networking, and</li>
  <li>BGP and IPv6 support.</li>
</ol>

<p><b>Today’s challenge</b></p>

<p>As a commercial open-source project, VyOS restricts download access to its official releases to paying
subscribers, and it’s priced for enterprises.  While there are a few ways you might qualify for free access
(see https://vyos.net/get/), most people will not.</p>

<p>The solution is to build our own VyOS release.  The VyOS project provides a combination of good documentation
and excellent tooling which makes this easy.</p>

<p>In this blog post, I will show how to build VyOS 1.3.x equuleus, at this time the latest VyOS LTS release, for
deployment to the Vultr Cloud platform.  Follow-up blog posts will complete the deployment of VyOS as an edge router
and perimeter firewall in front of a robust, multi-segmented internal network on the Vultr Cloud platform.</p>

<p><b>Outline of the solution</b></p>
<ol>
  <li>Deploy a Cloud Instance (the “build instance”) via Vultr portal</li>
  <li>SSH to the build instance as the root user</li>
  <li>Install Docker Engine on the build instance</li>
  <li>Execute the VyOS ISO build procedure</li>
  <li>Configure web server software to host the ISO</li>
  <li>Use Vultr portal to pull the ISO into the Vultr account</li>
  <li>Save a copy of the ISO and destroy the build instance</li>
  <li>Intermission and additional background</li>
  <li>Deploy a second Cloud Instance (the “template instance”) via Vultr portal</li>
  <li>Access the template instance by its virtual console and install VyOS</li>
  <li>Snapshot the template instance</li>
  <li>Destroy the template instance</li>
  <li>Validation</li>
  <li>Credits</li>
</ol>

<p><b>Deploy a Cloud Instance (the “build instance”) via Vultr portal</b></p>

<ol>
  <li>
    <p>In your Vultr portal, under Products &gt; Compute, select Deploy &gt; Deploy New Server.</p>
  </li>
  <li>Fill out the form to specify details about your new instance.
    <ol>
      <li>Cloud Compute &gt; Regular Performance (AMD or Intel) server is fine.</li>
      <li>Debian 12 x64</li>
      <li>Select an instance type with 25 GB SSD.</li>
      <li>Specify a hostname, vyos-build.</li>
      <li>Optionally add an SSH key, or just plan to SSH using root password.</li>
      <li>Deploy Now</li>
    </ol>
  </li>
  <li>Observe your vyos-build instance running in Vultr portal. Note its IP address. Also, drill in to retrieve the
root user’s credential unless you pushed your own SSH key.
<img src="/assets/img/vyos-build-instance-running.png" alt="shell screenshot" /></li>
</ol>

<p><b>SSH to the build instance as the root user</b></p>

<ol>
  <li>
    <p>You will need your vyos-build instance’s IP address and credentials from the Deploy step above.</p>
  </li>
  <li>
    <p>Use any SSH client (such as PuTTY) to connect to your vyos-build instance.  The username is root regardless
of whether you are using the root user’s password or have pushed an SSH key; the key, if provided, was installed
to the root user’s account, no named user account was created.</p>
  </li>
  <li>
    <p>You are ready to move forward once you have obtained a root shell:
<img src="/assets/img/vyos-build-root-shell.png" alt="shell screenshot" /></p>
  </li>
</ol>

<p><b>Install Docker Engine on the build instance</b></p>

<p>There are different ways you can build VyOS.  Building using a Docker container is the approach I will cover.</p>

<p>You will need to have Docker Engine installed.  The version in Debian’s package repository is adequate.</p>

<ol>
  <li>It’s a one-line install:
    <div class="language-plaintext highlighter-rouge"><div class="highlight"><pre class="highlight"><code>apt -y install docker.io
</code></pre></div>    </div>
    <p>You’re on track if your kick-off of the command looks roughly like this:
<img src="/assets/img/apt-install-docker-io.png" alt="shell screenshot" /></p>
  </li>
</ol>

<p><b>Execute the VyOS ISO build procedure</b></p>

<p>To recap, you should currently be logged into a 25 GB SSD Cloud Instance on Vultr, have Docker Engine installed, and be sitting at a root prompt in the root user’s home directory.  If that’s where you are, you’re ready to move forward.</p>

<p>This is what you need to do to build your VyOS 1.3 LTS release ISO.</p>

<ol>
  <li>Pull the Docker image that will be used to build the ISO:
    <div class="language-plaintext highlighter-rouge"><div class="highlight"><pre class="highlight"><code>docker pull vyos/vyos-build:equuleus
</code></pre></div>    </div>
    <p>Successful completion should look like this (after pages of output):
<img src="/assets/img/vyos-build-docker-pull.png" alt="shell screenshot" /></p>
  </li>
  <li>Clone the repository:
    <div class="language-plaintext highlighter-rouge"><div class="highlight"><pre class="highlight"><code>git clone -b equuleus --single-branch https://github.com/vyos/vyos-build vyos-build-1.3
</code></pre></div>    </div>
    <p>This is how it should look in the shell:
<img src="/assets/img/vyos-build-git-clone.png" alt="shell screenshot" /></p>
  </li>
  <li>Switch into the cloned repository:
    <div class="language-plaintext highlighter-rouge"><div class="highlight"><pre class="highlight"><code>cd vyos-build-1.3/
</code></pre></div>    </div>
    <p><img src="/assets/img/vyos-build-cd-vyos-build.png" alt="shell screenshot" /></p>
  </li>
  <li>Copy in the Vultr apt repository signing key (we will integrate Vultr’s cloud-init):
    <div class="language-plaintext highlighter-rouge"><div class="highlight"><pre class="highlight"><code>cp /etc/apt/trusted.gpg.d/vultr-apprepo.gpg .
</code></pre></div>    </div>
    <p><img src="/assets/img/vyos-build-cp-aptkey.png" alt="shell screenshot" /></p>
  </li>
  <li>Run the build container:
    <div class="language-plaintext highlighter-rouge"><div class="highlight"><pre class="highlight"><code>docker run --rm -it --privileged -v $(pwd):/vyos -w /vyos vyos/vyos-build:equuleus bash
</code></pre></div>    </div>
    <p>This switches into the build environment. Notice how the prompt changes:
<img src="/assets/img/vyos-build-docker-run.png" alt="shell screenshot" /></p>
  </li>
  <li>Run the configure script in the container:
    <div class="language-plaintext highlighter-rouge"><div class="highlight"><pre class="highlight"><code>./configure \
  --architecture amd64 \
  --build-by lincoln@decoursey.com \
  --build-type release \
  --version "1.3-$(date +'%Y-%m-%d')" \
  --custom-apt-entry "deb [arch=amd64] https://apprepo.vultr.com/debian universal main" \
  --custom-apt-key /vyos/vultr-apprepo.gpg \
  --custom-package cloud-init
</code></pre></div>    </div>
    <p>How it should look:
<img src="/assets/img/vyos-build-configure.png" alt="shell screenshot" /></p>
  </li>
  <li>Create the ISO:
    <div class="language-plaintext highlighter-rouge"><div class="highlight"><pre class="highlight"><code>make iso
</code></pre></div>    </div>
    <p>This takes a while so feel free to step away.  When you do get your prompt back it should look like this:
<img src="/assets/img/vyos-build-make-iso.png" alt="shell screenshot" /></p>
  </li>
  <li>Once the above step is completed, you should be able to see your ISO file in the filesystem.
    <div class="language-plaintext highlighter-rouge"><div class="highlight"><pre class="highlight"><code>ls -ltr build
</code></pre></div>    </div>
    <p>Make note of your ISO image filename, as you will need to substitute it into some later commands.
<img src="/assets/img/vyos-build-ls-build.png" alt="shell screenshot" /></p>
  </li>
  <li>Exit the Docker container &amp; return you to the host OS.
    <div class="language-plaintext highlighter-rouge"><div class="highlight"><pre class="highlight"><code>exit
</code></pre></div>    </div>
    <p>Notice the prompt changes back:
<img src="/assets/img/vyos-build-exit-from-docker.png" alt="shell screenshot" /></p>
  </li>
  <li>Place a copy of the ISO file into the root user’s home directory before moving on.  This is just
to be foolproof.  You need to substitute your actual ISO filename into the sample command below:
    <div class="language-plaintext highlighter-rouge"><div class="highlight"><pre class="highlight"><code>cp build/vyos-1.3-2024-01-07-amd64.iso ~
</code></pre></div>    </div>
    <p><img src="/assets/img/vyos-build-cp-artifact.png" alt="shell screenshot" /></p>
  </li>
</ol>

<p><b>Configure web server software to host the ISO</b></p>

<p>Besides building the VyOS ISO, we will also need to arrange web hosting for it. Vultr’s custom ISO support is based
around us initially hosting the custom ISO image, providing Vultr with a download URL for it, and then Vultr imports it
from there to its storage.</p>

<ol>
  <li>Install web server software.
    <div class="language-plaintext highlighter-rouge"><div class="highlight"><pre class="highlight"><code>apt -y install nginx
</code></pre></div>    </div>
    <p><img src="/assets/img/vyos-build-install-nginx.png" alt="shell screenshot" /></p>
  </li>
  <li>Allow inbound http access through the host-based firewall.
    <div class="language-plaintext highlighter-rouge"><div class="highlight"><pre class="highlight"><code>ufw allow http
</code></pre></div>    </div>
    <p><img src="/assets/img/vyos-build-ufw-allow-http.png" alt="shell screenshot" /></p>
  </li>
  <li>Copy the new ISO image into the base content directory for the web server software.
Substitute your actual ISO filename in place of vyos-1.3-2024-01-07-amd64.iso.
    <div class="language-plaintext highlighter-rouge"><div class="highlight"><pre class="highlight"><code>cp ~/vyos-1.3-2024-01-07-amd64.iso /var/www/html/
</code></pre></div>    </div>
    <p><img src="/assets/img/vyos-build-cp-var-www-html.png" alt="shell screenshot" /></p>
  </li>
  <li>The ISO file should now be web accessible, via the build instance.  To validate, work up the access URL using the
IP address of your build instance (that shows up in your Vultr portal) and the hostname of the ISO file from step 3.
Download the ISO file using a web browser.
    <div class="language-plaintext highlighter-rouge"><div class="highlight"><pre class="highlight"><code>http://[your vyos-build instance's IP]/[your ISO filename]
</code></pre></div>    </div>
    <p><img src="/assets/img/vyos-build-download-iso.png" alt="shell screenshot" /></p>
  </li>
</ol>

<p><b>Use Vultr portal to pull the ISO into the Vultr account</b></p>

<ol>
  <li>
    <p>In the Vultr portal, under Products &gt; Orchestration &gt; ISOs, select Add ISO.</p>
  </li>
  <li>
    <p>Paste the URL for your ISO image being hosted by your build instance on Vultr
<img src="/assets/img/vyos-build-add-iso.png" alt="shell screenshot" /></p>
  </li>
  <li>
    <p>Click the Upload button.  You should see an “ISO downloading” status.
<img src="/assets/img/vyos-build-iso-downloading.png" alt="shell screenshot" /></p>
  </li>
  <li>
    <p>After a while, navigate back to Productions &gt; Orchestration &gt; ISOs.  You should now see your ISO available.
<img src="/assets/img/vyos-build-iso-available.png" alt="shell screenshot" /></p>
  </li>
</ol>

<p><b>Save a copy of the ISO and destroy the build instance</b></p>

<ol>
  <li>
    <p>At some point we will want this same VyOS ISO for use elsewhere, and the Vultr portal will not give us back a copy.
Let’s make sure to have retrieved a full copy of the ISO from the build instance to some safekeeping location (e.g.
Downloads directory).
<img src="/assets/img/vyos-build-iso-download-complete.png" alt="shell screenshot" /></p>
  </li>
  <li>
    <p>Now that the VyOS ISO build is complete, the build instance is no longer required.  Stop the build
instance, via Vultr’s portal, and destroy it.  Products &gt; Compute &gt; vyos-build &gt; Server Stop, Server Destroy.<br />
<img src="/assets/img/vyos-build-server-destroy.png" alt="shell screenshot" /></p>
  </li>
</ol>

<p><b>Intermission and additional background</b></p>

<p>So far we have created a VyOS ISO image, which is a VyOS live CD environment and installer.  It is, in a nutshell,
bootable VyOS installation media.</p>

<p>Bootable installation media is a major way for baremetal servers to be OS-installed and remains a viable option for
installing virtual machines, too.  Drawbacks of this method include the use of a live person to drive an OS
installation wizard, which forecloses online provisioning, the subtle inconsistencies that result, and the extensive
amount of time the package-by-package installation process can take.  While mitigations exist for these drawbacks, no
matter how much engineering is added, unavoidably this server provisioning strategy involves a ton of moving parts.</p>

<p>Image-based provisioning has emerged as a standard in enterprises for eliminating OS software installation from the
provision-time process.  Instead, an OS install process is completed just once, on a workbench.  A snapshot is then
taken of the installed system to serve as a base (or “golden”) image from which additional servers of the same type
will be cloned.  Cloud instances and larger VM fleets under modern hypervisors are deployed almost exclusively using
this strategy.</p>

<p>Let’s convert our ISO to a Vultr snapshot so that provisioning can happen in a modern way.</p>

<p><b>Deploy a second Cloud Instance (the “template instance”) via Vultr portal</b></p>
<ol>
  <li>In your Vultr portal, under Products &gt; Compute, select Deploy &gt; Deploy New Server.</li>
  <li>Fill out the form to specify details about your new instance.
    <ol>
      <li>Cloud Compute &gt; Regular Performance (AMD or Intel) server is fine.</li>
      <li>Upload ISO &gt; select your VyOS 1.3 ISO</li>
      <li>Select an instance type with at least 1 GB RAM</li>
      <li>Specify a hostname e.g. vyos-template.</li>
      <li>Click Deploy Now, under Products &gt; Compute, watch for instance startup</li>
    </ol>
  </li>
</ol>

<p><b>Access the template instance by its virtual console and install VyOS</b></p>
<ol>
  <li>Find your instance in the Vultr portal at Products &gt; Compute &gt; vyos-template</li>
  <li>At the right, open the three-dot menu and select the option to View Console
<img src="/assets/img/vyos-build-template-view-console.png" alt="shell screenshot" /></li>
  <li>Once the virtual console opens, you should notice a login prompt:
<img src="/assets/img/vyos-build-vyos-template-login.png" alt="shell screenshot" /></li>
  <li>Log into the console using the default credentials:
    <div class="language-plaintext highlighter-rouge"><div class="highlight"><pre class="highlight"><code>u: vyos
p: vyos
</code></pre></div>    </div>
    <p><img src="/assets/img/vyos-build-template-logged-in.png" alt="shell screenshot" /></p>
  </li>
  <li>Execute these few “show configuration commands” commands one at a time, observe output:
    <div class="language-plaintext highlighter-rouge"><div class="highlight"><pre class="highlight"><code>show configuration commands | match hw-id
show configuration commands | match host-name
show configuration commands | match name-server
</code></pre></div>    </div>
    <p><img src="/assets/img/vyos-build-template-show-configuration.png" alt="shell screenshot" /></p>
  </li>
  <li>Enter configuration mode:
    <div class="language-plaintext highlighter-rouge"><div class="highlight"><pre class="highlight"><code>configure
</code></pre></div>    </div>
  </li>
  <li>Based on the output from step 5 above, work up and execute corresponding commands to delete each of those
configuration items.  “set” becomes “delete” for each item:
    <div class="language-plaintext highlighter-rouge"><div class="highlight"><pre class="highlight"><code>delete interfaces ethernet eth0 hw-id '56:00:04:b7:fe:d4'
delete system host-name 'vyos-template'
delete system name-server '108.61.10.10'
delete system name-server 'eth0'
</code></pre></div>    </div>
    <p><img src="/assets/img/vyos-build-template-config-delete.png" alt="shell screenshot" /></p>
  </li>
  <li>Commit those configuration changes:
    <div class="language-plaintext highlighter-rouge"><div class="highlight"><pre class="highlight"><code>commit
</code></pre></div>    </div>
    <p><img src="/assets/img/vyos-build-template-commit.png" alt="shell screenshot" /></p>
  </li>
  <li>Save those configuration changes:
    <div class="language-plaintext highlighter-rouge"><div class="highlight"><pre class="highlight"><code>save
</code></pre></div>    </div>
    <p><img src="/assets/img/vyos-build-template-save.png" alt="shell screenshot" /></p>
  </li>
  <li>Exit from configuration mode:
    <div class="language-plaintext highlighter-rouge"><div class="highlight"><pre class="highlight"><code>exit
</code></pre></div>    </div>
    <p><img src="/assets/img/vyos-build-template-exit-config.png" alt="shell screenshot" /></p>
  </li>
  <li>Execute the VyOS install-to-disk command and take the defaults (just hit Enter) up until the
“Continue: (Yes/No) [No]” prompt:
    <div class="language-plaintext highlighter-rouge"><div class="highlight"><pre class="highlight"><code>install image
</code></pre></div>    </div>
    <p><img src="/assets/img/vyos-build-template-install-image.png" alt="shell screenshot" /></p>
  </li>
  <li>This prompt you must explicitly respond to with “Yes” to confirm the wipe/repartition of the virtual HDD:
    <div class="language-plaintext highlighter-rouge"><div class="highlight"><pre class="highlight"><code>Yes
</code></pre></div>    </div>
    <p><img src="/assets/img/vyos-build-template-confirm-yes.png" alt="shell screenshot" /></p>
  </li>
  <li>Resume taking the defaults (just hit Enter) until you are prompted about the vyos password.  This is asking you
to assign a new password for the vyos user that will carry over into the snapshot image.
    <div class="language-plaintext highlighter-rouge"><div class="highlight"><pre class="highlight"><code>1mYarqCY3MHbE69     # example, pick your own!
</code></pre></div>    </div>
    <p><img src="/assets/img/vyos-build-template-enter-password.png" alt="shell screenshot" /></p>
  </li>
  <li>The installation is wrapping up now. Just hit Enter. Install completes &amp; normal prompt returns:
<img src="/assets/img/vyos-build-template-hit-enter.png" alt="shell screenshot" /></li>
  <li>It is best practice to log out of any server’s console once you are finished using it, to avoid leaving a shell
prompt that an unexpected person may otherwise stumble onto.  Following best practices for proper exit and
clean shutdown even during the decommissioning process is a sign of respect, and covers all bases in case plans
change.
    <div class="language-plaintext highlighter-rouge"><div class="highlight"><pre class="highlight"><code>exit
</code></pre></div>    </div>
    <p><img src="/assets/img/vyos-build-template-logout.png" alt="shell screenshot" /></p>
  </li>
</ol>

<p><b>Snapshot the template instance</b></p>
<ol>
  <li>
    <p>Products &gt; Compute, find the vyos-template image, open its three-dot menu, and let’s power the instance off for good
measure.  Select the option Server Stop.
 <img src="/assets/img/vyos-build-template-power-off.png" alt="shell screenshot" /></p>
  </li>
  <li>From Products &gt; Compute, again drill into the vyos-template instance and, on the Snapshots tab, use the option to
take a snapshot.
<img src="/assets/img/vyos-build-take-snapshot.png" alt="shell screenshot" /></li>
  <li>Click the Take Snapshot button.  You should see a snapshot in progress result
<img src="/assets/img/vyos-build-snapshot-progress.png" alt="shell screenshot" /></li>
  <li>Products &gt; Orchestration &gt; Snapshots, watch for the snapshot to become available after a fair while
<img src="/assets/img/vyos-build-snapshot-available.png" alt="shell screenshot" /></li>
</ol>

<p><b>Destroy the template instance</b></p>
<ol>
  <li>Once the shapshot is available, the vyos-template cloud instance is no longer needed.<br />
Destroy that cloud instance now. Products &gt; Compute &gt; vyos-template &gt; Server Destroy.
<img src="/assets/img/vyos-build-destroy-template.png" alt="shell screenshot" /></li>
</ol>

<p><b>Validation</b></p>

<p>It is important to validate your work.  For example, after deploying a backup solution, test restoring from it.
After configuring an alert related to PSU redundancy, pull one of the redundant PSUs.  Does the alert come through?
If you have engineered a failover mechanism, think about how you might trigger it in order to validate the solution.</p>

<p>In this case, we need to test-deploy a VyOS instance to be sure it comes up cleanly and looks good.  And this is just
a quick sanity check.  Fuller checks and acceptance tests will be performed as part of an actual Proof of Concept to
be covered in subsequent posts.</p>

<ol>
  <li>In your Vultr portal, under Products &gt; Compute, select Deploy &gt; Deploy New Server.</li>
  <li>Fill out the form to specify details about your new instance.
    <ol>
      <li>Cloud Compute &gt; Regular Performance (AMD or Intel) server is fine.</li>
      <li>Snapshot &gt; Select your vyos-template snapshot</li>
      <li>Select an instance type with at least 1 GB RAM</li>
      <li>Specify a hostname e.g. vyos-test-1</li>
      <li>Deploy Now</li>
    </ol>
  </li>
  <li>Once you see your vyos-test-1 instance running in Vultr portal, wait a few minutes for the system to complete
booting and for cloud-init to have a chance to initialize the configuration.  Then, use any SSH client to check it
out.  If you encounter problems with SSH access, fall back to the virtual console to investigate.
<img src="/assets/img/vyos-build-success.png" alt="shell screenshot" /></li>
  <li>Once you’re done testing, go ahead and destroy your test server.  Keeping track of test/dev resources that have
been allocated to you, or that you have spun for yourself, and returning or deleting them when no longer needed
is a good practice and will set you apart in most workplaces.</li>
</ol>

<p><b>Credits</b></p>

<ol>
  <li>Official VyOS build documentation – https://docs.vyos.io/en/equuleus/contributing/build-vyos.html</li>
  <li>Helped me, copied some steps too – https://wiki.gbe0.com/networking/vyos/docker-build</li>
</ol>]]></content><author><name></name></author><summary type="html"><![CDATA[Introduction]]></summary></entry></feed>